

HOT TOPICS LIST
- MACD
- Fibonacci
- RSI
- Gann
- ADXR
- Stochastics
- Volume
- Triangles
- Futures
- Cycles
- Volatility
- ZIGZAG
- MESA
- Retracement
- Aroon
INDICATORS LIST
LIST OF TOPICS
PRINT THIS ARTICLE
by Donald W. Pendergast, Jr.
Shares of Gamestop Corp. enjoyed a 200%+ rally over the past year, but has the "smart money" been selling out?
Position: N/A
Donald W. Pendergast, Jr.
Freelance financial markets writer and online publisher of the Trendzetterz.com S&P 500 Weekly Forecast service.
PRINT THIS ARTICLE
TECHNICAL ANALYSIS
Gamestop: Game Over?
08/08/13 03:57:35 PMby Donald W. Pendergast, Jr.
Shares of Gamestop Corp. enjoyed a 200%+ rally over the past year, but has the "smart money" been selling out?
Position: N/A
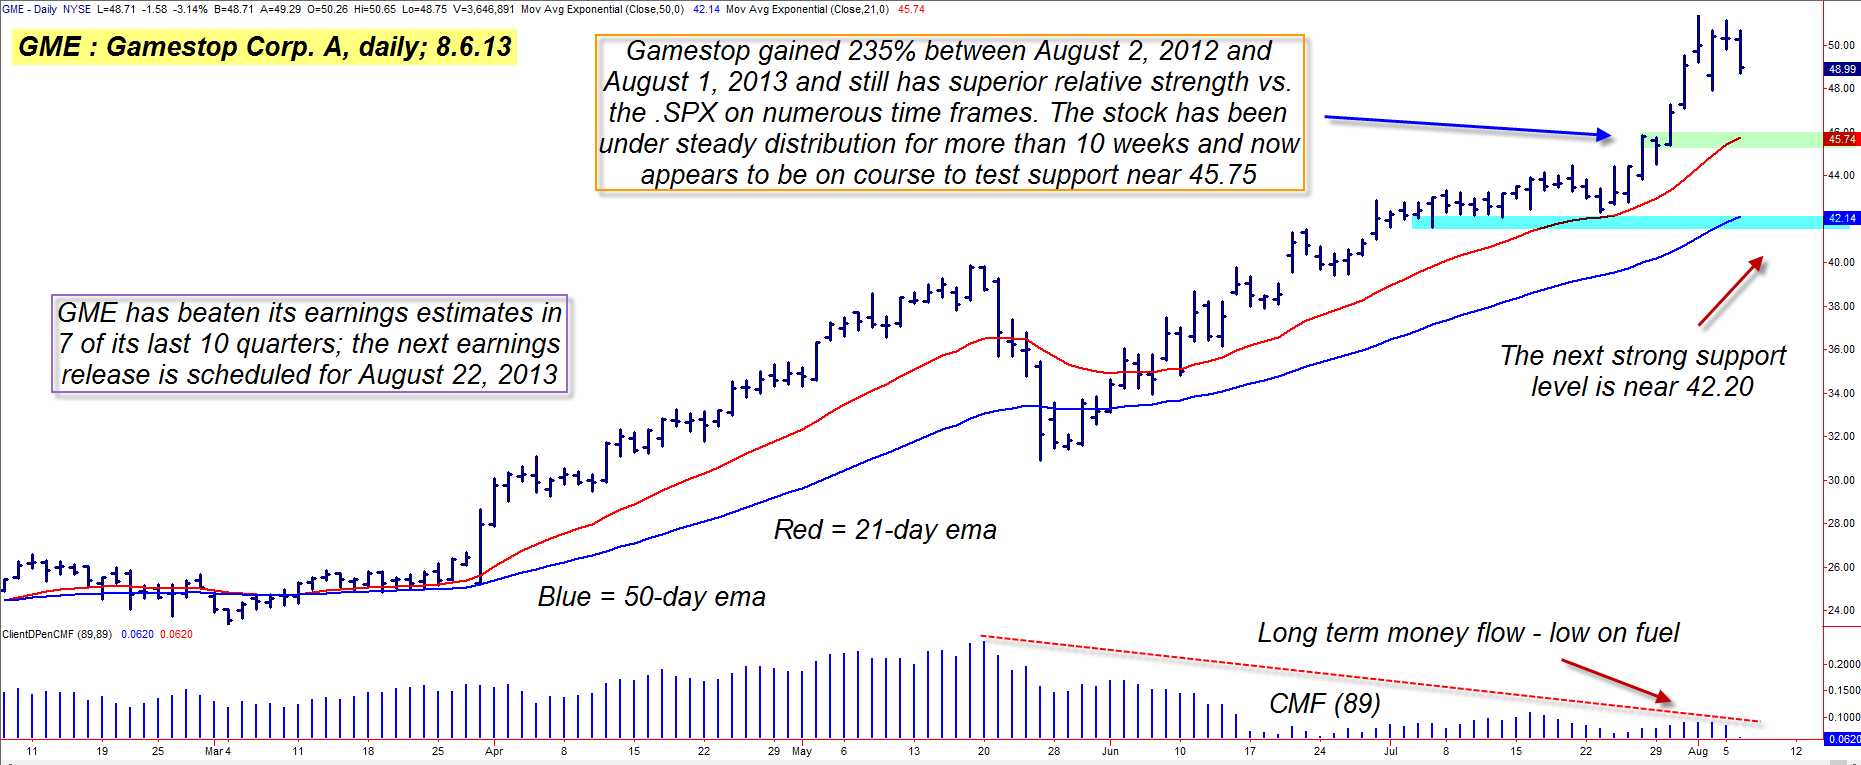
| Although shares of Gamestop Corp. 'A' (GME) are still shy of recovering all of its losses between December 2007 and August 2012 (after it plummeted from 63.68 to 15.32), it has still managed to rise by more than 200% since coming out of a major multicycle low last summer. At first glance (Figure 1), GME's uptrend still looks to be in fine technical shape, but a key volume-based indicator has been warning of an impending bearish trend reversal since May 2013. Here's a closer look now. |
|
| Figure 1. Gamestop (GME) may be on the verge of a swift move lower toward initial support in the 45.75 area. The stock has been under marked distribution since late May 2013. |
| Graphic provided by: TradeStation. |
| |
| Any large cap stock that can gain more than 200% in one year is definitely going to be of interest to traders, and one of the primary reasons why GME has soared is due to its stellar earnings history; over the last ten quarters, the stock has been able to beat analyst estimates seven times. Additionally, it met earnings estimates in the other three quarters and it's easy to see why this stock was bought so aggressively since last summer. "Buy high, sell higher" does seem to have been a good game plan for GME bulls since that August 2012 multicycle low was made, but when we examine the long-term money flow, we find that GME has been under persistent distribution (smart money selling out to latecomers and inexperienced traders/investors). The 89-day Chaikin Money flow histogram (CMF)(89) provides proof=positive that the latest rally swing (late May to early August) was achieved on much lower volume levels, levels that were unable to push GME up past a major supply zone near 51.50. This cycle of accumulation and distribution repeats over and over again in all liquid stocks. Early identification of these dynamics can help traders prepare for major reversals well in advance of the actual turn and can be used the help make other methods of technical/fundamental analysis even more effective and profitable. |
|
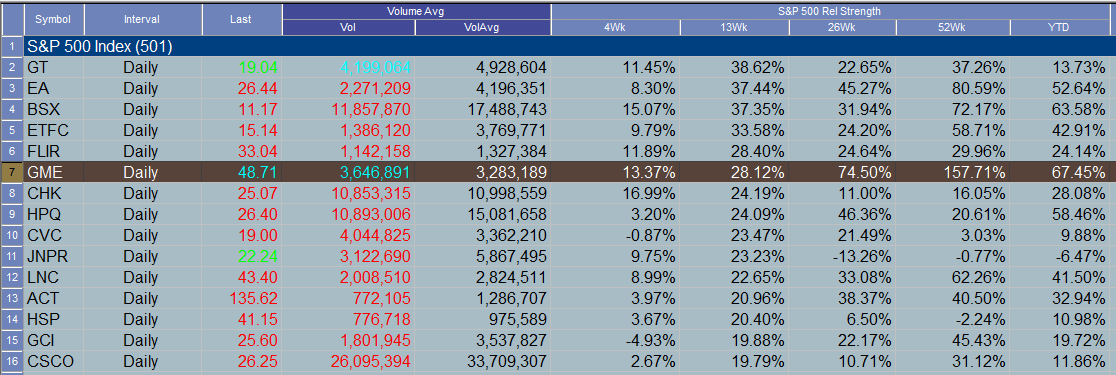
| Figure 2. Gamestop (GME) has been outperforming the .SPX by a wide margin over the past 4-, 13-, 26- and 52-week periods. |
| Graphic provided by: TradeStation. |
| Graphic provided by: TradeStation Radar Screen. |
| |
| Here's one way to play GME on the short side using put options: 1. If GME drops below 48.75 during the next two sessions, buy the October '13 GME $49 put option. 2. Use 50.65 as your mental stop loss and sell the put if GME hits 46.00 or if the option gains 90% or loses 50% of its value. 3. If you have a decent open profit by the time that earnings are released (before the open on August 22, 2013), consider taking at least partial, if not all of your profits to avoid seeing them disappear on an adverse market move. 4. Risk no more than 1% of your account value on this reversal style trade. Asian markets are selling off hard as this is written, perhaps warning of more weakness in the major US stock indexes in the days and weeks ahead; this bear play in GME stands to profit nicely if the S&P 500 index (.SPX) is just beginning a noticeable correction phase. Trade wisely until we meet here again. |
Freelance financial markets writer and online publisher of the Trendzetterz.com S&P 500 Weekly Forecast service.
| Title: | Market consultant and writer |
| Company: | Trendzetterz |
| Address: | 81 Hickory Hollow Drive |
| Crossville, TN 38555 | |
| Phone # for sales: | 904-303-4814 |
| Website: | trendzetterz.com |
| E-mail address: | support@trendzetterz.com |
Traders' Resource Links | |
| Trendzetterz has not added any product or service information to TRADERS' RESOURCE. | |
Click here for more information about our publications!
PRINT THIS ARTICLE

Request Information From Our Sponsors
- VectorVest, Inc.
- Executive Premier Workshop
- One-Day Options Course
- OptionsPro
- Retirement Income Workshop
- Sure-Fire Trading Systems (VectorVest, Inc.)
- Trading as a Business Workshop
- VectorVest 7 EOD
- VectorVest 7 RealTime/IntraDay
- VectorVest AutoTester
- VectorVest Educational Services
- VectorVest OnLine
- VectorVest Options Analyzer
- VectorVest ProGraphics v6.0
- VectorVest ProTrader 7
- VectorVest RealTime Derby Tool
- VectorVest Simulator
- VectorVest Variator
- VectorVest Watchdog
- StockCharts.com, Inc.
- Candle Patterns
- Candlestick Charting Explained
- Intermarket Technical Analysis
- John Murphy on Chart Analysis
- John Murphy's Chart Pattern Recognition
- John Murphy's Market Message
- MurphyExplainsMarketAnalysis-Intermarket Analysis
- MurphyExplainsMarketAnalysis-Visual Analysis
- StockCharts.com
- Technical Analysis of the Financial Markets
- The Visual Investor