HOT TOPICS LIST
- MACD
- Fibonacci
- RSI
- Gann
- ADXR
- Stochastics
- Volume
- Triangles
- Futures
- Cycles
- Volatility
- ZIGZAG
- MESA
- Retracement
- Aroon
INDICATORS LIST
LIST OF TOPICS
PRINT THIS ARTICLE
by Koos van der Merwe
With the Dow correcting as expected, buying when everyone is selling becomes the strategy. What to buy is the problem.
Position: Sell
Koos van der Merwe
Has been a technical analyst since 1969, and has worked as a futures and options trader with First Financial Futures in Johannesburg, South Africa.
PRINT THIS ARTICLE
ENVELOPES
Is Disney A Buy?
08/07/13 04:50:32 PMby Koos van der Merwe
With the Dow correcting as expected, buying when everyone is selling becomes the strategy. What to buy is the problem.
Position: Sell
| The market is correcting down as expected. The month of August could however, see a small upward correction as investors return from their vacation toward the end of the month, or could trade sideways on volume lower than average. Whatever happens, we do know that the month of September, notorious for being the quietest month of the year, looms ahead. Looking for stocks to buy as the market starts moving into October and the busiest months of the year, November to April, becomes a must. One of the shares worth looking at is Disney (Walt) Co. |

|
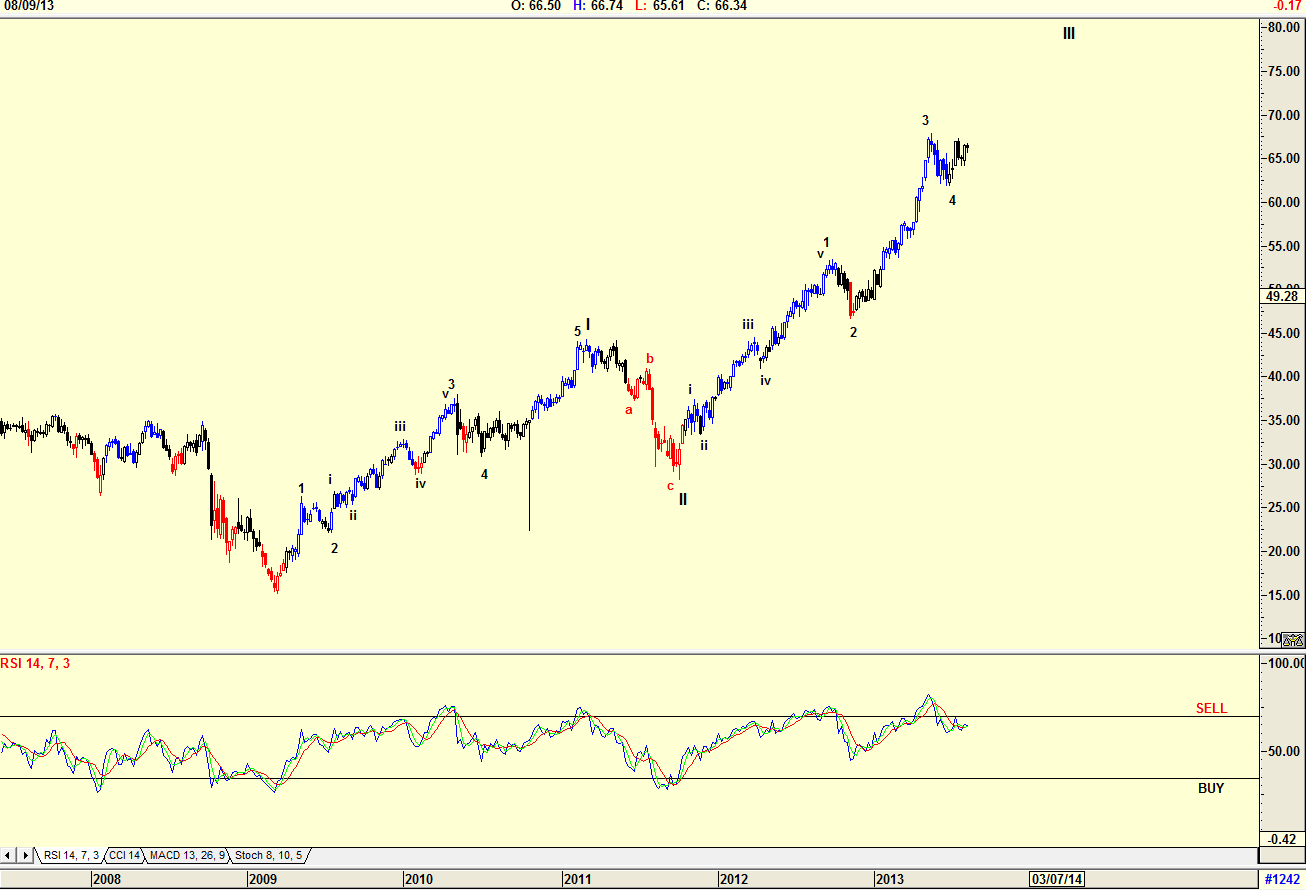
| Figure 1. Weekly chart of Disney with Elliott Wave Count. |
| Graphic provided by: AdvancedGET. |
| |
| The chart in Figure 1 is a weekly chart of Disney with an interesting Elliott Wave count. The first rule of Elliott Wave is that the chart must look correct. Looking at the weekly chart, the chart looks wrong. Wave 3 of WAVE III is shorter than Wave 1 of WAVE III. This means that Wave 5 of WAVE III must be shorter than Wave 3 of WAVE III. With the RSI having given a sell signal, and the share price moving sideways/down, there is doubt as to the immediate trend. |

|
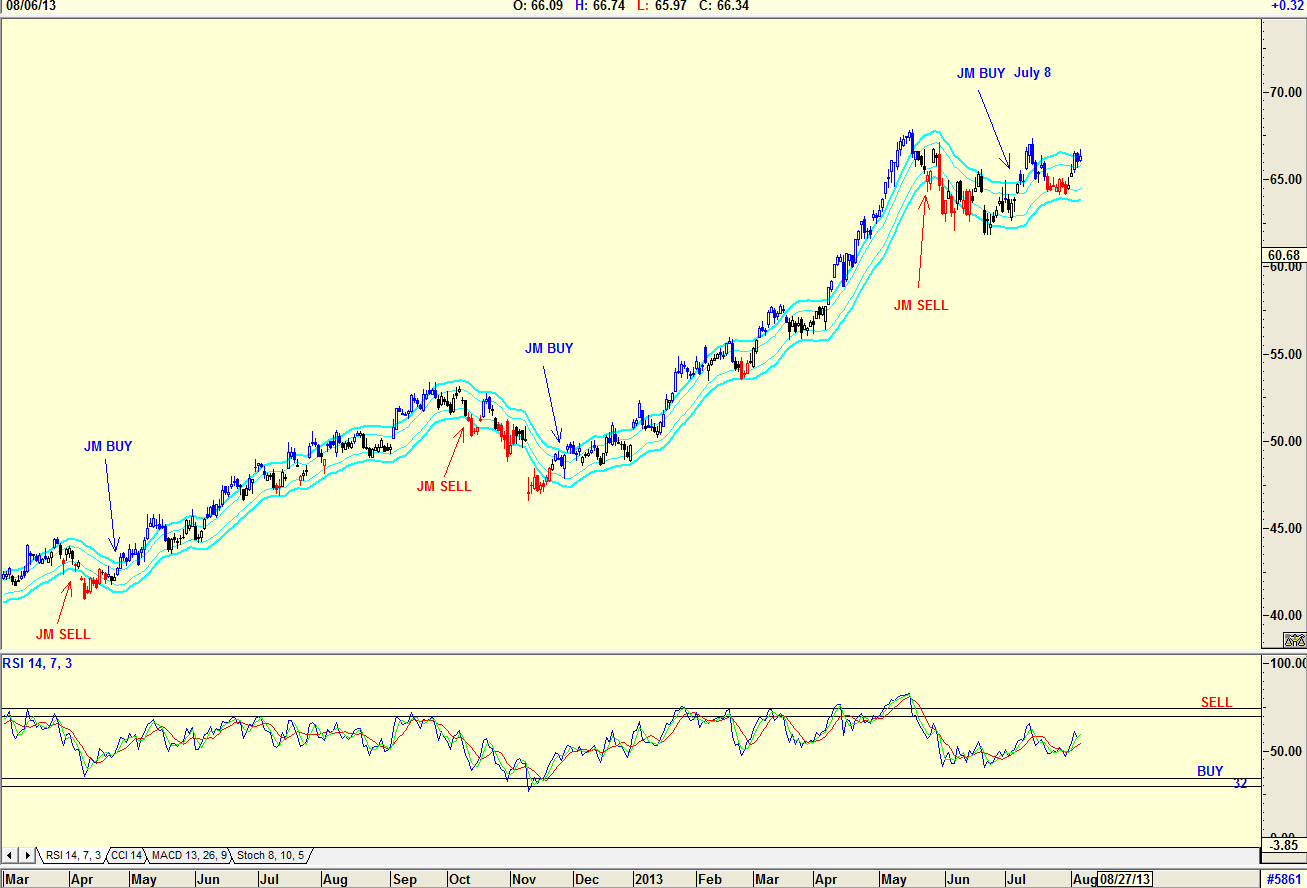
| Figure 2. Daily chart of Disney with JM Internal Band. |
| Graphic provided by: AdvancedGET. |
| |
| Figure 2 is a daily chart of Disney, with the JM internal band. The JM internal band is a 15-period simple moving average offset by 2% positive and 2% negative. A move above the upper band signals a buy and a move below the lower band signals a sell. As one can see on the chart, a buy signal was given on July 8, 2013. Although the share price has corrected down, a sell signal, where the price breaks below the lower band, has not been given. The price is testing the upper band, and a move up will signal another buy, even though the RSI indicator is suggesting weakness, simply because it appears to be moving sideways after a sell signal, and not falling to the buy zone of 32. |

|
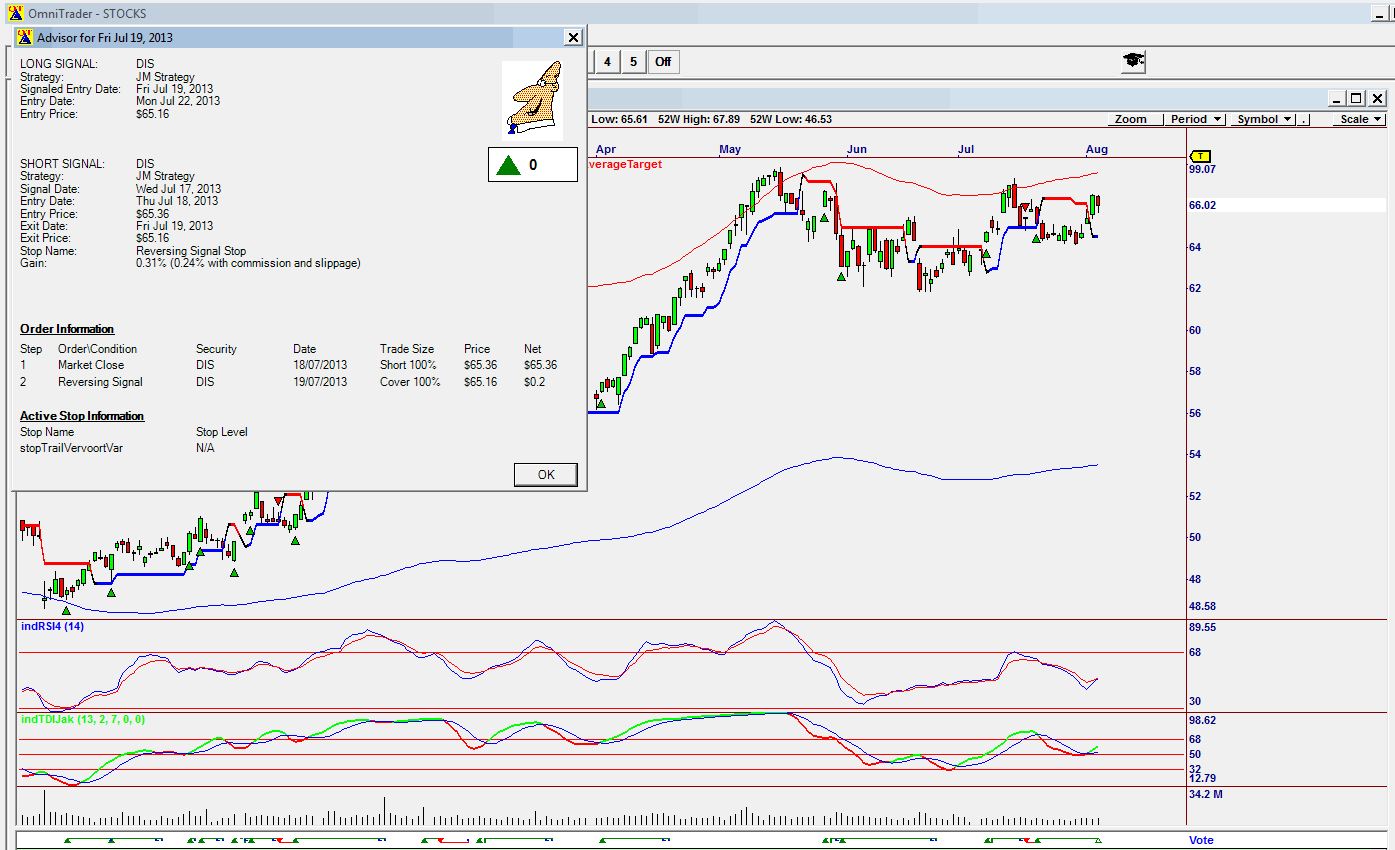
| Figure 3. Omnitrader daily chart of Disney with a ZERO Advisor rating |
| Graphic provided by: Omnitrader.. |
| |
| The chart in Figure 3 is an Omnitrader chart with a computerized vote line. Buy and sell signals are given based on performance meeting certain computerized strategies and parameters. Note the Advisor Rating, which has given the latest buy signal shown on the vote line a '0'. A buy signal with an Advisor Rating of less than 52 should not be considered. Price is testing the red upper band, another negative signal. No matter how tempting a buy for Disney looks, I would not be a buyer at the moment. However, the share is on my watch list for a possible future buy if all my buy parameters are met. |
Has been a technical analyst since 1969, and has worked as a futures and options trader with First Financial Futures in Johannesburg, South Africa.
| Address: | 3256 West 24th Ave |
| Vancouver, BC | |
| Phone # for sales: | 6042634214 |
| E-mail address: | petroosp@gmail.com |
Click here for more information about our publications!
PRINT THIS ARTICLE

Request Information From Our Sponsors
- VectorVest, Inc.
- Executive Premier Workshop
- One-Day Options Course
- OptionsPro
- Retirement Income Workshop
- Sure-Fire Trading Systems (VectorVest, Inc.)
- Trading as a Business Workshop
- VectorVest 7 EOD
- VectorVest 7 RealTime/IntraDay
- VectorVest AutoTester
- VectorVest Educational Services
- VectorVest OnLine
- VectorVest Options Analyzer
- VectorVest ProGraphics v6.0
- VectorVest ProTrader 7
- VectorVest RealTime Derby Tool
- VectorVest Simulator
- VectorVest Variator
- VectorVest Watchdog
- StockCharts.com, Inc.
- Candle Patterns
- Candlestick Charting Explained
- Intermarket Technical Analysis
- John Murphy on Chart Analysis
- John Murphy's Chart Pattern Recognition
- John Murphy's Market Message
- MurphyExplainsMarketAnalysis-Intermarket Analysis
- MurphyExplainsMarketAnalysis-Visual Analysis
- StockCharts.com
- Technical Analysis of the Financial Markets
- The Visual Investor
