HOT TOPICS LIST
- MACD
- Fibonacci
- RSI
- Gann
- ADXR
- Stochastics
- Volume
- Triangles
- Futures
- Cycles
- Volatility
- ZIGZAG
- MESA
- Retracement
- Aroon
INDICATORS LIST
LIST OF TOPICS
PRINT THIS ARTICLE
by Donald W. Pendergast, Jr.
Shares of Duke Realty recently ended a multi-month rally. Will its latest major pullback to support result in another leg higher?
Position: N/A
Donald W. Pendergast, Jr.
Freelance financial markets writer and online publisher of the Trendzetterz.com S&P 500 Weekly Forecast service.
PRINT THIS ARTICLE
SUPPORT & RESISTANCE
DRE: Will Its 200-Day Average Provide Support?
08/07/13 04:42:37 PMby Donald W. Pendergast, Jr.
Shares of Duke Realty recently ended a multi-month rally. Will its latest major pullback to support result in another leg higher?
Position: N/A
| With the S&P 500 index (.SPX) still trading right near its all-time highs, scanning for large and mid-cap stocks making pullbacks to key support levels makes a lot of sense. Now, of course, some technicians would argue that all of the major US stock indexes are making new highs on ridiculously low volumes and that another blast of bad news out of Europe or China could very well be the precipitating event that starts a 5-10% correction sometime between now and early fall 2013 — but since no one knows just when the top will appear (or how deep the eventual correction will be) — the only sane way to play the markets here is to look for stocks pulling back to heavy-duty support levels for as long as the .SPX and .NDX (NASDAQ 100 index) continue to trend upward. Here's a look at a real estate industry group stock — Duke Realty (DRE) — that meets those criteria. |

|
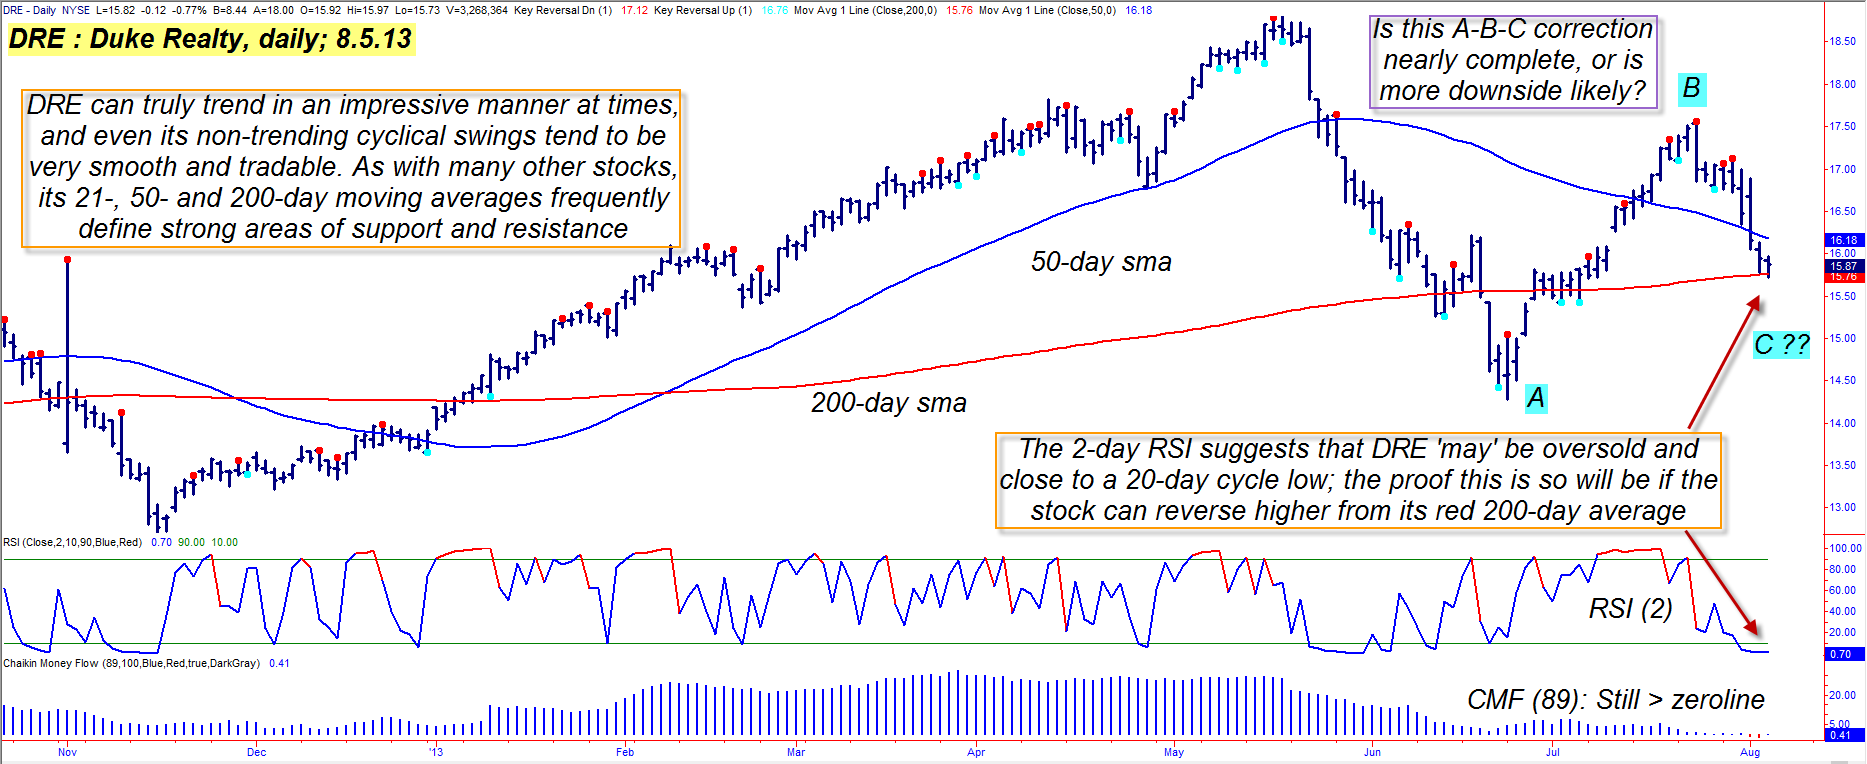
| Figure 1. Not only do shares of Duke Realty (DRE) trend well, they also tend to make very tradable swing moves, too. |
| Graphic provided by: TradeStation. |
| |
| One of the most impressive aspects on DRE's daily chart (Figure 1) is the evidence of its trending capabilities — particularly when in bullish mode. Look at how low the daily volatility was during the six-month rally from November 2012-May 2013; notice that there were only two pullbacks of note during that entire run, one in which DRE tacked on gains of as much as 48%. DRE's massive uptrend was also confirmed by its rising 50- and 200-day simple moving averages (SMA); when the stock peaked in mid-May 2013, it didn't take long for a full-fledged trend reversal to print, one that was good for a 30% revaluation and a sharp break below its red 200-day SMA. Lately, though, DRE has found new strength, first rallying back above the all-important 200-day SMA and now dropping back down again to test it. This smooth, swing price action has resulted in a well-formed A-B-C corrective wave, with the jury still out as to whether or not wave C is fully complete. However, note that the two-day RSI is definitely in oversold zone and that the long-term money flow (based on the 89-day Chaikin Money flow histogram (CMF)(89)) is still above its zero line. In a bull market, this is normally an attractive setup that can allow for a long swing trade entry; in a broad market that may be transitioning from a bull to bear or bull to consolidation phase, these entries become less reliable, however. |

|
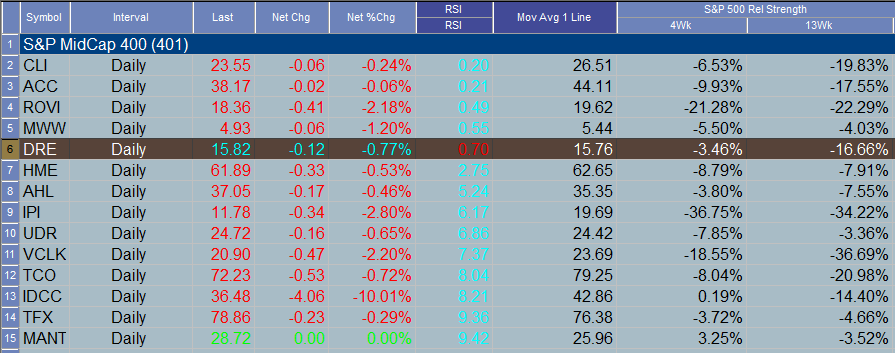
| Figure 2. No shortage of mid-cap stocks making substantial pullbacks on Monday August 5, 2013 (based on the 2-day RSI); DRE is trading just above its 200-day SMA and also has positive long term money flow. |
| Graphic provided by: TradeStation. |
| Graphic provided by: TradeStation Radar Screen. |
| |
| Okay, here is the easy way to play DRE for a long swing trade: 1. Wait for Monday's high of 15.97 to be exceeded on a daily close. 2. Go long a couple of ticks above that high, but only if there have been no daily closes beneath the 200-day SMA in the interim. 3. Once filled, set your initial stop just below the 200-day SMA and begin to trail the stock with a 2- to 3-bar trailing stop of the daily lows. 4. Since it's impossible to know if DRE will begin to trend strongly again, it's best to assume that any bounce higher will be more of the cyclical variety and that once the two-day RSI makes a daily close back above 95.00 that it would be a great idea to take most (if not all) of your open profits. As a reversal-style trade setup, it's best to keep your account risk at a maximum of 1%, particularly with the broad markets so vulnerable to a correction. Keep your account diversified and don't be afraid to lighten up and go to cash if you get overly worried about having multiple long positions on at this time. There will be plenty of low-risk buy opportunities after the market finally corrects, so choose your positions wisely and keep your risks small until that happens. Trade wisely until we meet here again. |
Freelance financial markets writer and online publisher of the Trendzetterz.com S&P 500 Weekly Forecast service.
| Title: | Market consultant and writer |
| Company: | Trendzetterz |
| Address: | 81 Hickory Hollow Drive |
| Crossville, TN 38555 | |
| Phone # for sales: | 904-303-4814 |
| Website: | trendzetterz.com |
| E-mail address: | support@trendzetterz.com |
Traders' Resource Links | |
| Trendzetterz has not added any product or service information to TRADERS' RESOURCE. | |
Click here for more information about our publications!
PRINT THIS ARTICLE

Request Information From Our Sponsors
- StockCharts.com, Inc.
- Candle Patterns
- Candlestick Charting Explained
- Intermarket Technical Analysis
- John Murphy on Chart Analysis
- John Murphy's Chart Pattern Recognition
- John Murphy's Market Message
- MurphyExplainsMarketAnalysis-Intermarket Analysis
- MurphyExplainsMarketAnalysis-Visual Analysis
- StockCharts.com
- Technical Analysis of the Financial Markets
- The Visual Investor
- VectorVest, Inc.
- Executive Premier Workshop
- One-Day Options Course
- OptionsPro
- Retirement Income Workshop
- Sure-Fire Trading Systems (VectorVest, Inc.)
- Trading as a Business Workshop
- VectorVest 7 EOD
- VectorVest 7 RealTime/IntraDay
- VectorVest AutoTester
- VectorVest Educational Services
- VectorVest OnLine
- VectorVest Options Analyzer
- VectorVest ProGraphics v6.0
- VectorVest ProTrader 7
- VectorVest RealTime Derby Tool
- VectorVest Simulator
- VectorVest Variator
- VectorVest Watchdog
