HOT TOPICS LIST
- MACD
- Fibonacci
- RSI
- Gann
- ADXR
- Stochastics
- Volume
- Triangles
- Futures
- Cycles
- Volatility
- ZIGZAG
- MESA
- Retracement
- Aroon
INDICATORS LIST
LIST OF TOPICS
PRINT THIS ARTICLE
by Koos van der Merwe
Over the past week, Facebook shares closed above its IPO price.
Position: Sell
Koos van der Merwe
Has been a technical analyst since 1969, and has worked as a futures and options trader with First Financial Futures in Johannesburg, South Africa.
PRINT THIS ARTICLE
GAPS
Filling A Facebook Gap
08/06/13 03:48:12 PMby Koos van der Merwe
Over the past week, Facebook shares closed above its IPO price.
Position: Sell
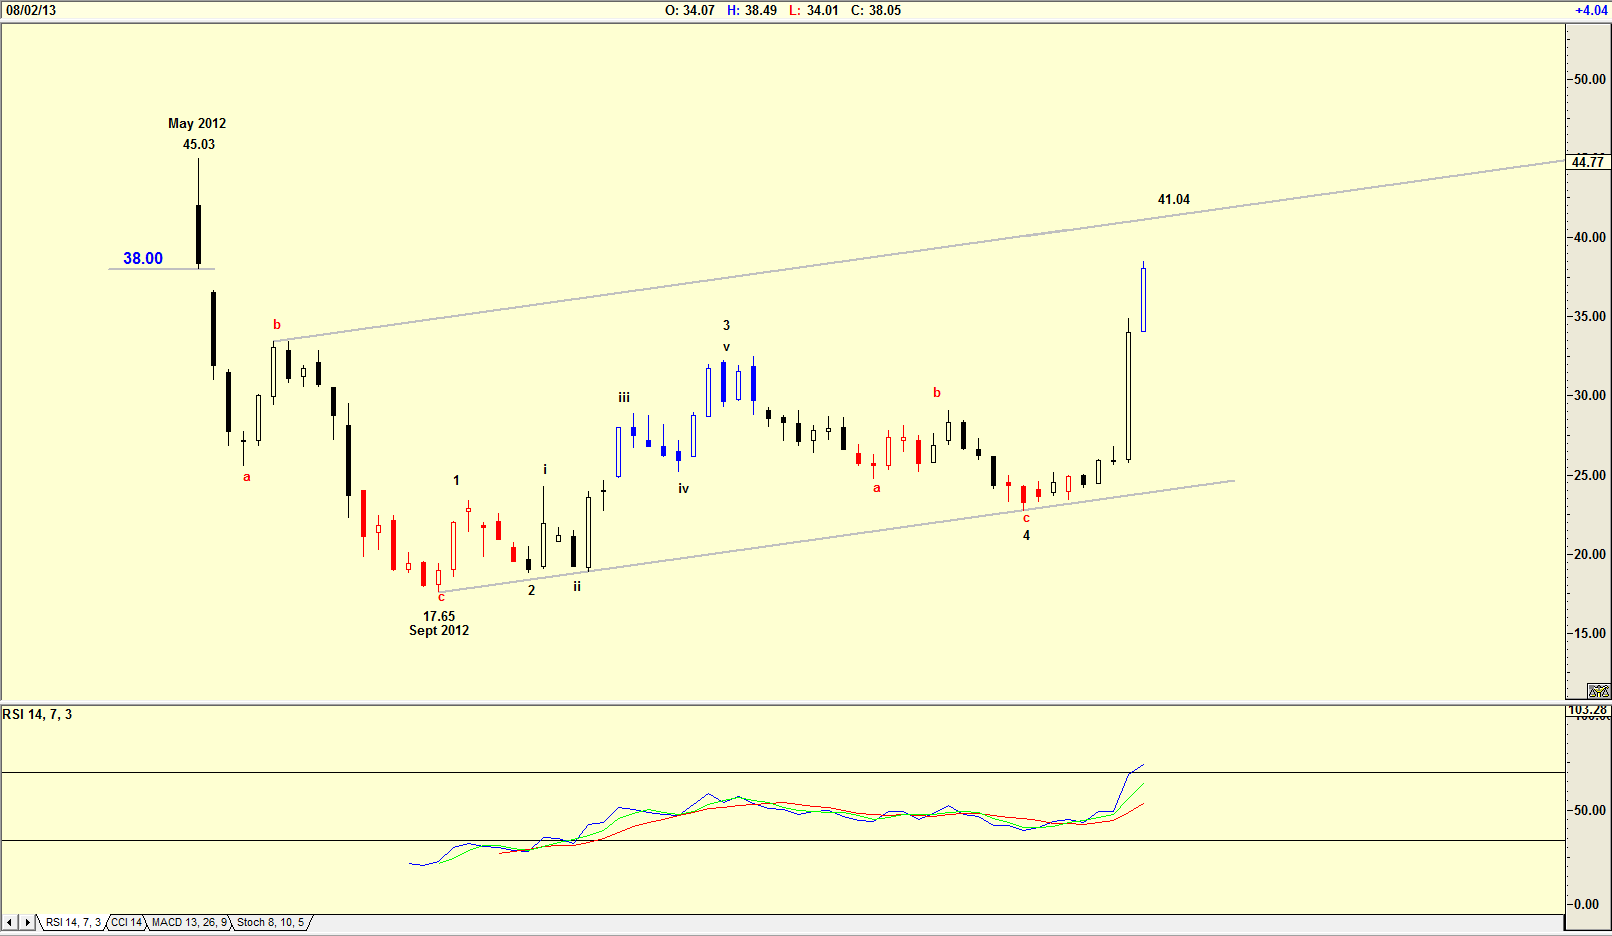
| We all know about Facebook's disastrous IPO, where the share fell from $38 to a low of $17.65 by September 2012. Of course we all know that there was a mess up that negatively impacted the IPO. We have all wondered how Mark Zuckerberg would correct Facebook's share price, and this past week were very pleased when the share price of Facebook (FB) rose above $38.00. |

|
| Figure 1. Weekly chart of Facebook. |
| Graphic provided by: AdvancedGET. |
| |
| The weekly chart in Figure 1 of FB shows how the share price rose from $38.00 to $45.03 in May 2012 and then collapsed to $17.65 by September 2012. Since then the share price has gradually risen to its present price of $38.05. The chart shows a resistance level of $41.04 suggesting that the price could rise to that level over the week ahead. Do note the RSI is at overbought levels. |

|
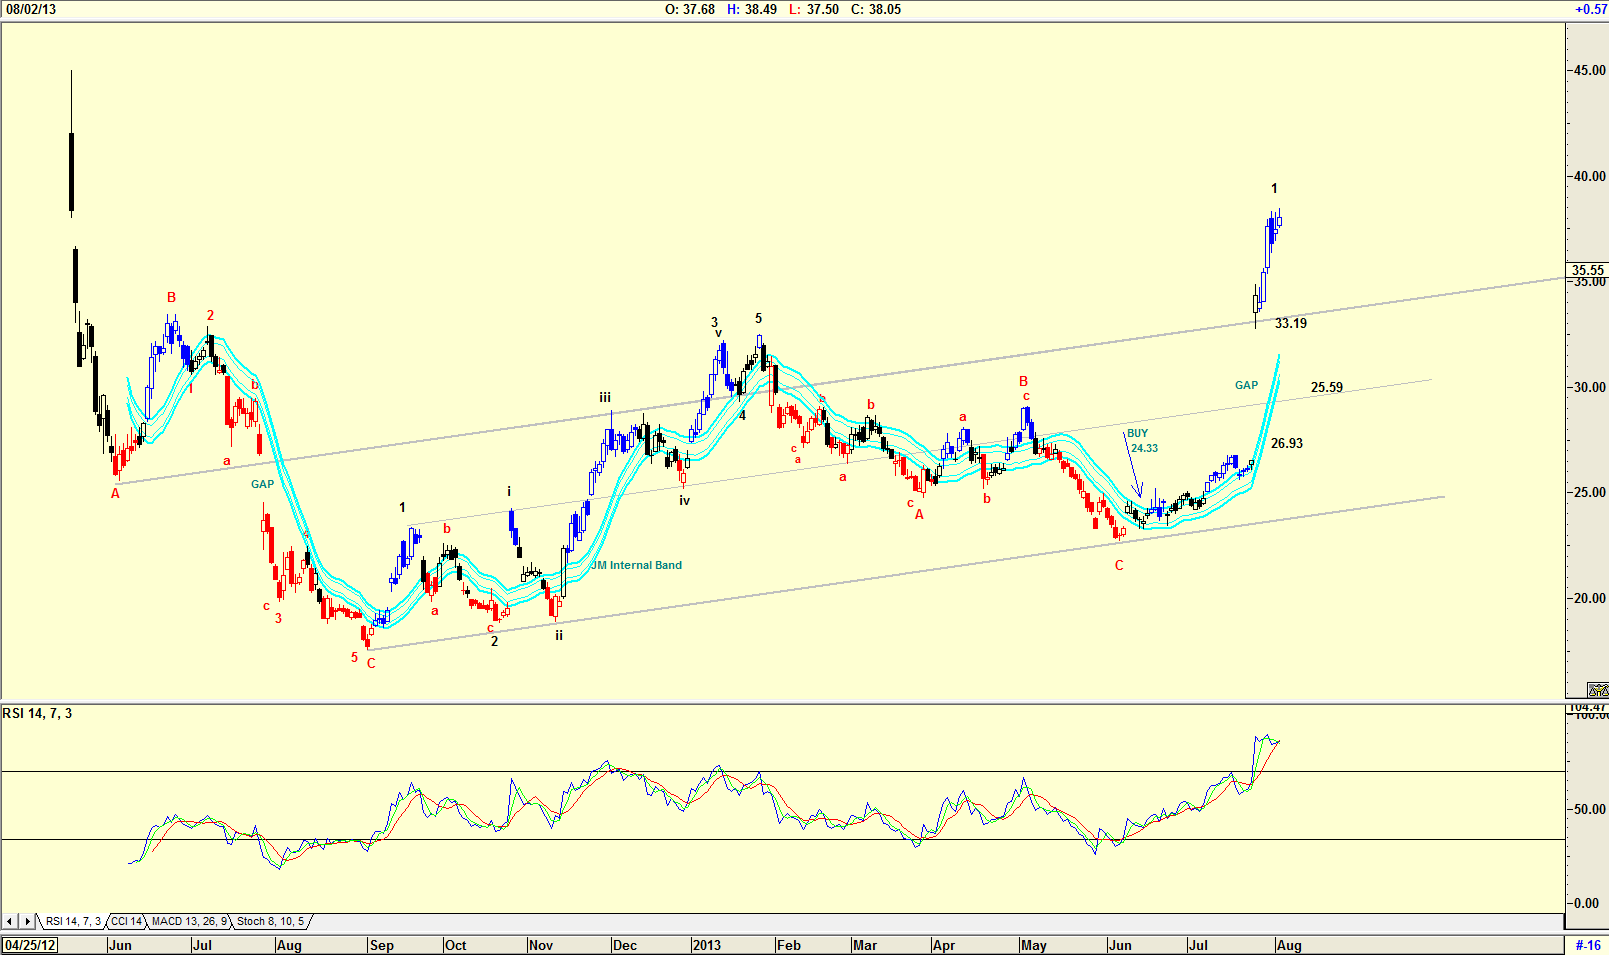
| Figure 2. Daily chart showing gaps. |
| Graphic provided by: AdvancedGET. |
| |
| The daily chart in Figure 2 shows an Elliott Wave count suggesting that FB is due for a Wave 2 correction. This is confirmed by the rule, "a price will fall to fill the gap," somewhere between $26.93 and $33.19. The support line drawn parallel to the main support and resistance line is suggesting a price of $25.59. With the RSI in overbought levels, the chance of a correction in a Wave 2, is very likely. The JM Internal band gave a buy signal when the price was $24.33 resulting in a profitable trade. I would be a seller of FB shares at the current price, and wait for the correction to "fill the gap." |
Has been a technical analyst since 1969, and has worked as a futures and options trader with First Financial Futures in Johannesburg, South Africa.
| Address: | 3256 West 24th Ave |
| Vancouver, BC | |
| Phone # for sales: | 6042634214 |
| E-mail address: | petroosp@gmail.com |
Click here for more information about our publications!
PRINT THIS ARTICLE

|

Request Information From Our Sponsors
- VectorVest, Inc.
- Executive Premier Workshop
- One-Day Options Course
- OptionsPro
- Retirement Income Workshop
- Sure-Fire Trading Systems (VectorVest, Inc.)
- Trading as a Business Workshop
- VectorVest 7 EOD
- VectorVest 7 RealTime/IntraDay
- VectorVest AutoTester
- VectorVest Educational Services
- VectorVest OnLine
- VectorVest Options Analyzer
- VectorVest ProGraphics v6.0
- VectorVest ProTrader 7
- VectorVest RealTime Derby Tool
- VectorVest Simulator
- VectorVest Variator
- VectorVest Watchdog
- StockCharts.com, Inc.
- Candle Patterns
- Candlestick Charting Explained
- Intermarket Technical Analysis
- John Murphy on Chart Analysis
- John Murphy's Chart Pattern Recognition
- John Murphy's Market Message
- MurphyExplainsMarketAnalysis-Intermarket Analysis
- MurphyExplainsMarketAnalysis-Visual Analysis
- StockCharts.com
- Technical Analysis of the Financial Markets
- The Visual Investor
