

HOT TOPICS LIST
- MACD
- Fibonacci
- RSI
- Gann
- ADXR
- Stochastics
- Volume
- Triangles
- Futures
- Cycles
- Volatility
- ZIGZAG
- MESA
- Retracement
- Aroon
INDICATORS LIST
LIST OF TOPICS
PRINT THIS ARTICLE
by Donald W. Pendergast, Jr.
Shares of Boston Scientific Corp. are up more than 100% since November 2012 but may be preparing to correct soon.
Position: N/A
Donald W. Pendergast, Jr.
Freelance financial markets writer and online publisher of the Trendzetterz.com S&P 500 Weekly Forecast service.
PRINT THIS ARTICLE
ACCUM./DIST. CHAIKIN
Boston Scientific Corp. - Money Flow Trend Crumbling
08/02/13 04:44:32 PMby Donald W. Pendergast, Jr.
Shares of Boston Scientific Corp. are up more than 100% since November 2012 but may be preparing to correct soon.
Position: N/A
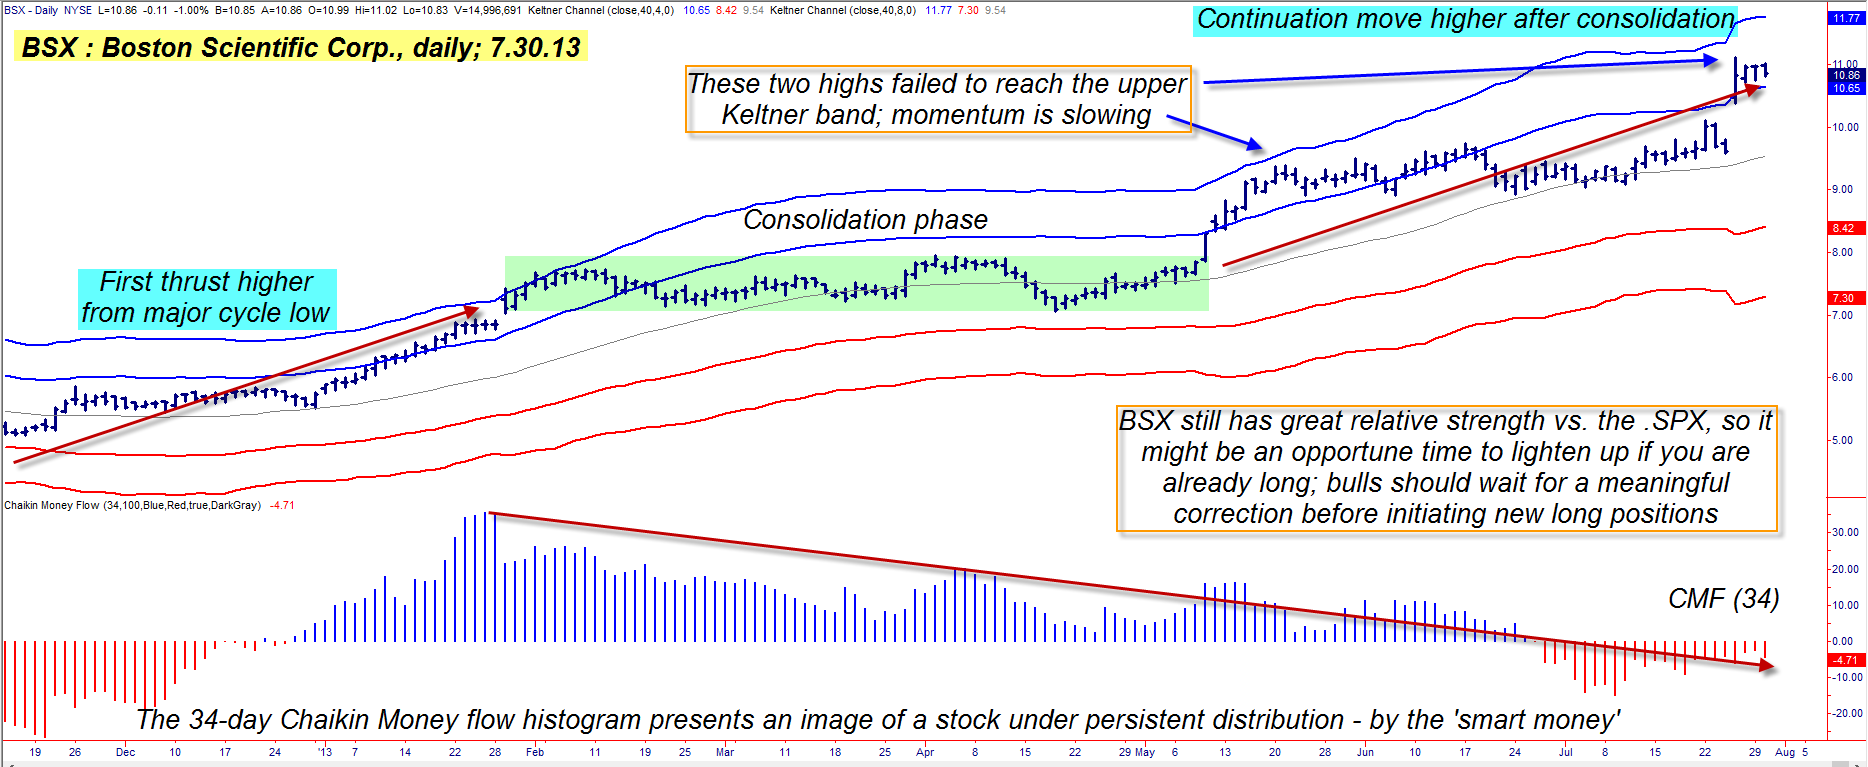
| Everyone likes to get on board with a winning stock, especially when it has already managed to double in price during an 11-month period; after all, one of the keys to stock market gains is to "buy high and sell higher" – right? From the looks of Boston Scientific's (BSX) daily chart in Figure 1, it appears that's the mindset of the traders and investors who've been pushing the stock higher out of its recent minor cycle low. But have they stopped to consider that the "smart money" – the professional traders who control 80% of the trading volume in the US markets – appear to have been distributing their holdings of BSX at a steady pace since late February 2013? Here's a closer look now. |
|
| Figure 1. Two incredible technical dynamics (a continuation pattern and a distribution pattern) manage to overlap on the same daily chart; the extremely bearish money flow trend is a warning for current longs in BSX to take protective measures. |
| Graphic provided by: TradeStation. |
| |
| This is a most remarkable technical chart, and for two reasons: 1.The existence of a near-textbook quality "continuation" pattern. 2. The crystal-clear pattern of distribution – where stock is unloaded by "strong hands" into "weak hands" – aka: the so-called "dumb money." While it's true that continuation patterns play out on a regular basis and in a wide variety of stocks, it's not so common to witness such blatant, obvious patterns of distribution in a stock that has completed such a price pattern. I mean, just look at it! Sure, the money flow histogram went – and stayed – positive on December 27, 2012, and not until June 26, 2013 did it dip back into bearish territory again. That's not the crazy thing here; no, it was that BSX kept climbing to a fresh four-year high even as the (CMF)(34) histogram remained mired in its "red zone." Okay, so that pretty much confirms that the bulk of the buying on the most recent upswing is being done by latecomers who still believe that BSX is going to continue its winning ways for some time to come. Will it? No one knows, but the probabilities are now weighing heavily for a substantial correction, one that might easily get back down toward the 9.75 to 10.00 range within the next week or two. There is also another ominous technical, which is that although BSX hit the upper Keltner band in late January 2013, on each of the two subsequent swings to new highs, the stock failed to reach the same band. That's yet another sign of slowing upward momentum and should serve as fair warning to those currently long BSX at a time of negative money flow trends. |
|
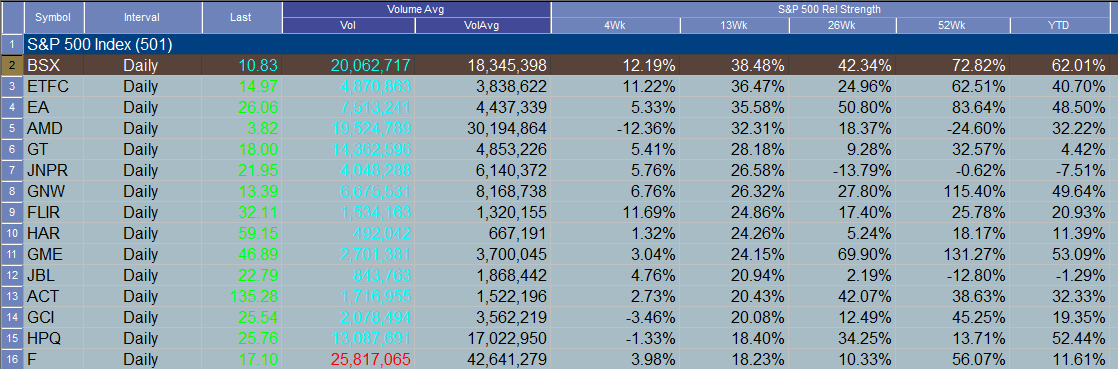
| Figure 2. BSX still has superb short- and long-term relative strength vs. the .SPX; the "smart money" has been selling into this strength for many months already. |
| Graphic provided by: TradeStation. |
| Graphic provided by: TradeStation Radar Screen. |
| |
| Obviously, those who are long BSX need to be running close trailing stops or buying protective put options to guard against a sudden reversal; speculative bears might consider buying the September '13 BSX $11.00 put, should BSX drop back below the 10.40 level. This put has a very small bid/ask spread and an open interest figure of 466 contracts; it could be an attractive vehicle with which to profit from a bearish reversal in BSX as we head into August 2013. Given that the Keltner mid-line is near 9.75, that might be a great initial profit target for such a bearish put play in BSX; keep your account risk at 1 or 2% max and by no means let the option lose more than 50 to 60% of its value at any time. If it does decline that far, just sell it and wait for a better trade setup to come along. Trade wisely until we meet here again. |
Freelance financial markets writer and online publisher of the Trendzetterz.com S&P 500 Weekly Forecast service.
| Title: | Market consultant and writer |
| Company: | Trendzetterz |
| Address: | 81 Hickory Hollow Drive |
| Crossville, TN 38555 | |
| Phone # for sales: | 904-303-4814 |
| Website: | trendzetterz.com |
| E-mail address: | support@trendzetterz.com |
Traders' Resource Links | |
| Trendzetterz has not added any product or service information to TRADERS' RESOURCE. | |
Click here for more information about our publications!
PRINT THIS ARTICLE

Request Information From Our Sponsors
- StockCharts.com, Inc.
- Candle Patterns
- Candlestick Charting Explained
- Intermarket Technical Analysis
- John Murphy on Chart Analysis
- John Murphy's Chart Pattern Recognition
- John Murphy's Market Message
- MurphyExplainsMarketAnalysis-Intermarket Analysis
- MurphyExplainsMarketAnalysis-Visual Analysis
- StockCharts.com
- Technical Analysis of the Financial Markets
- The Visual Investor
- VectorVest, Inc.
- Executive Premier Workshop
- One-Day Options Course
- OptionsPro
- Retirement Income Workshop
- Sure-Fire Trading Systems (VectorVest, Inc.)
- Trading as a Business Workshop
- VectorVest 7 EOD
- VectorVest 7 RealTime/IntraDay
- VectorVest AutoTester
- VectorVest Educational Services
- VectorVest OnLine
- VectorVest Options Analyzer
- VectorVest ProGraphics v6.0
- VectorVest ProTrader 7
- VectorVest RealTime Derby Tool
- VectorVest Simulator
- VectorVest Variator
- VectorVest Watchdog