HOT TOPICS LIST
- MACD
- Fibonacci
- RSI
- Gann
- ADXR
- Stochastics
- Volume
- Triangles
- Futures
- Cycles
- Volatility
- ZIGZAG
- MESA
- Retracement
- Aroon
INDICATORS LIST
LIST OF TOPICS
PRINT THIS ARTICLE
by Gary Grosschadl
The directional movement indicator (ADX) is a trend strength indicator that can be used in a variety of ways including spotting potential bottom reversals (an inherent higher risk play).
Position: N/A
Gary Grosschadl
Independent Canadian equities trader and technical analyst based in Peterborough
Ontario, Canada.
PRINT THIS ARTICLE
Risky Bottom Reversals And Directional Movement - Kasten Chase
09/12/02 09:13:51 AMby Gary Grosschadl
The directional movement indicator (ADX) is a trend strength indicator that can be used in a variety of ways including spotting potential bottom reversals (an inherent higher risk play).
Position: N/A
| The directional movement indicator tracks the total net price movement over a period of time. It identifies the speed and strength of trends and is composed of three components. The first, +DI, is a measure of the positive or upward movement of the stock. Similarly, -DI is a measure of the stock's negative or downward movement. The last component, ADX, shows the strength of the upward or downward trend. When ADX increases, this signifies that the trend is getting stronger and the market is becoming more directional. |
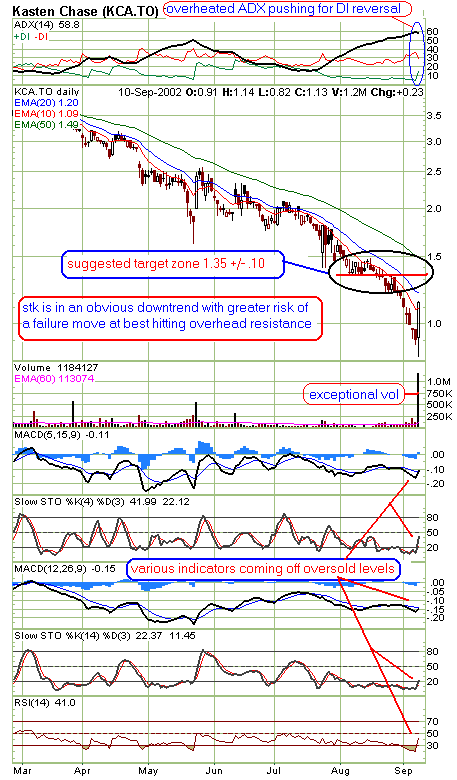
| ADX at extreme levels can lead to abrupt reversals. I like to call these "overheated ADX pushing for DI reversal." These are normally a short-term stock play when they work, as in a two to four day surge upwards and since, in this case, they are bottom reversals they carry more risk as these moves can be brief bear rallies. |

|
| Graphic provided by: stockcharts.com. |
| |
| In this timely example a small tech stock specializing in supplying secure access to classified networks (military applications) is making a high volume move off a news release. When the ADX line is above both DIs it is considered to be "high" territory. Sometimes these levels reach extremes -- over 40 or even above 50 -- and this is the case here. This is telling us that the current negative trend is extremely overheated and due for an abrupt change. When the DI lines finally start to converge and the ADX line starts to come down from its peak, aggressive traders (higher risk profile) may decide to take early entry. Ideally this leads to an actual DI reversal giving more power to the move (+DI rises above -DI). |
| However the move may stall resulting in either a weak cross (with subseqent failure) or no cross at all. A failure to cross often means only a one or two day rise in stock price so traders have to be nimble. It can be safer at times to enter early (before the actual cross) since a timely exit can still protect some profits, but each case should be judged by its own merit. The exceptional volume here (on a high number of trades) is enticing enough to warrant the extra risk for the more daring short-term trader. |
| A flexible trading target of 1.35 would be reasonable but should be judged also by volume action. The next few days should ideally have increasing volume on rising price action. Often the first day of decreased volume spells the end of the move. This example is an aggressive high risk play. The same set up with a more senior stock coming out of a basing period vs a V-bottom would be a safer bet for a more conservative trader. |
Independent Canadian equities trader and technical analyst based in Peterborough
Ontario, Canada.
| Website: | www.whatsonsale.ca/financial.html |
| E-mail address: | gwg7@sympatico.ca |
Click here for more information about our publications!
Comments
Date: 09/17/02Rank: 5Comment:
Date: 09/24/02Rank: 4Comment:

Request Information From Our Sponsors
- StockCharts.com, Inc.
- Candle Patterns
- Candlestick Charting Explained
- Intermarket Technical Analysis
- John Murphy on Chart Analysis
- John Murphy's Chart Pattern Recognition
- John Murphy's Market Message
- MurphyExplainsMarketAnalysis-Intermarket Analysis
- MurphyExplainsMarketAnalysis-Visual Analysis
- StockCharts.com
- Technical Analysis of the Financial Markets
- The Visual Investor
- VectorVest, Inc.
- Executive Premier Workshop
- One-Day Options Course
- OptionsPro
- Retirement Income Workshop
- Sure-Fire Trading Systems (VectorVest, Inc.)
- Trading as a Business Workshop
- VectorVest 7 EOD
- VectorVest 7 RealTime/IntraDay
- VectorVest AutoTester
- VectorVest Educational Services
- VectorVest OnLine
- VectorVest Options Analyzer
- VectorVest ProGraphics v6.0
- VectorVest ProTrader 7
- VectorVest RealTime Derby Tool
- VectorVest Simulator
- VectorVest Variator
- VectorVest Watchdog
