

HOT TOPICS LIST
- MACD
- Fibonacci
- RSI
- Gann
- ADXR
- Stochastics
- Volume
- Triangles
- Futures
- Cycles
- Volatility
- ZIGZAG
- MESA
- Retracement
- Aroon
INDICATORS LIST
LIST OF TOPICS
PRINT THIS ARTICLE
by Donald W. Pendergast, Jr.
Shares of Electronic Arts, Inc. are still trading at multiyear highs, but is this stock getting vulnerable to a sell-off?
Position: N/A
Donald W. Pendergast, Jr.
Freelance financial markets writer and online publisher of the Trendzetterz.com S&P 500 Weekly Forecast service.
PRINT THIS ARTICLE
Electronic Arts, Inc. - Distribution Underway?
07/31/13 05:49:22 PMby Donald W. Pendergast, Jr.
Shares of Electronic Arts, Inc. are still trading at multiyear highs, but is this stock getting vulnerable to a sell-off?
Position: N/A
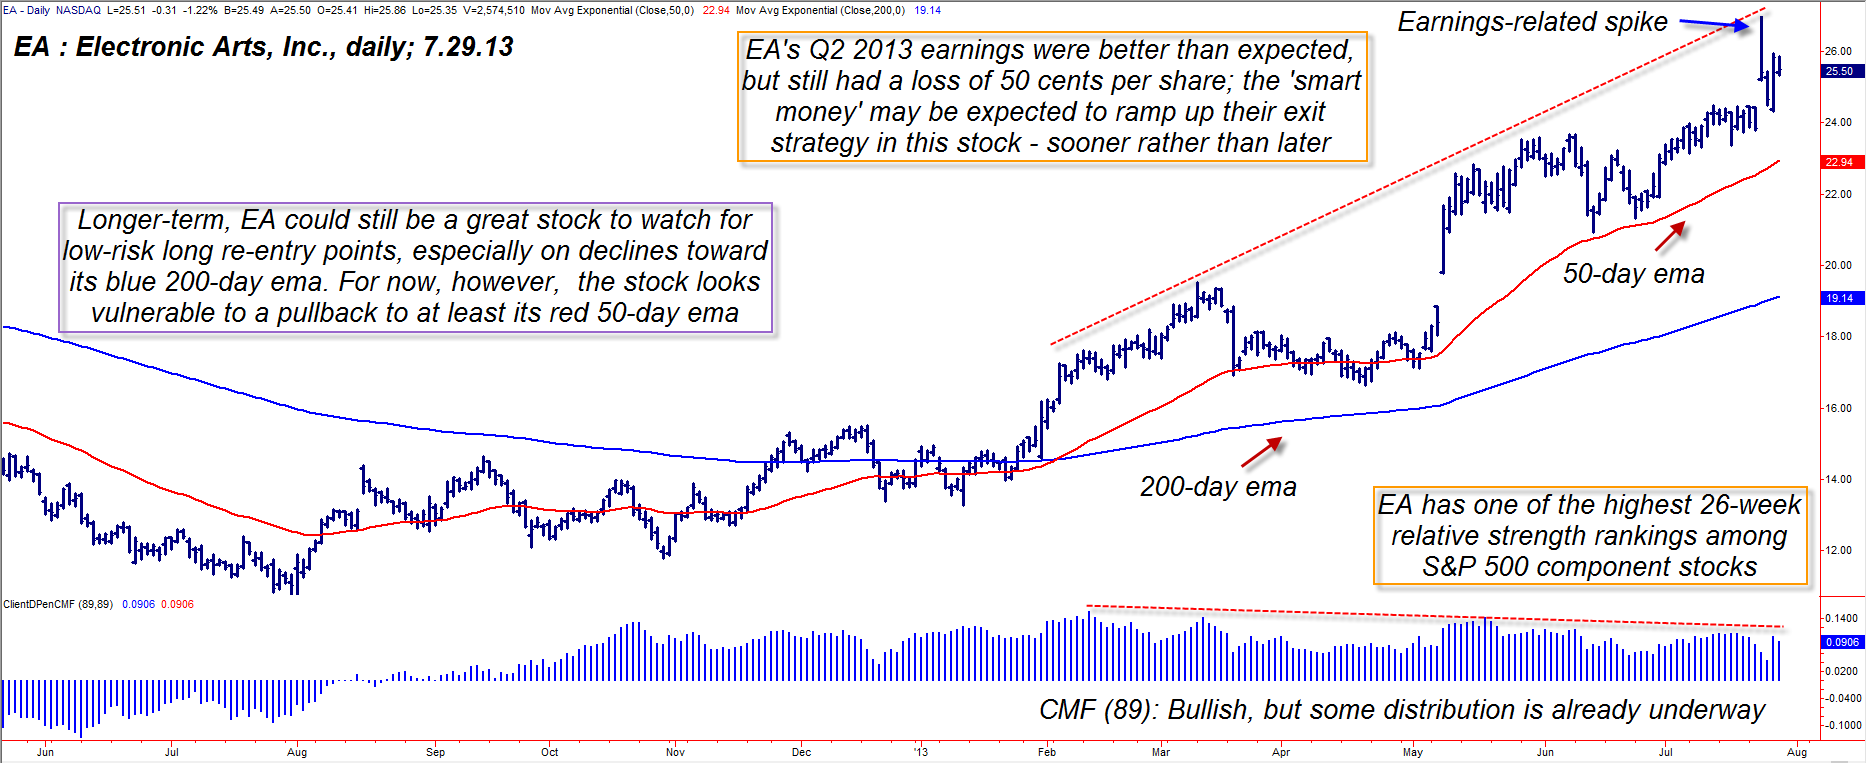
| Electronic Arts Inc. common stock (EA) really had a rough time of it between its October 2007 high of 60.41 and its subsequent major low set in August 2012, nearly five years later. That's when it dipped all the way to 10.77 per share, an 82% haircut; the stock has rebounded nicely over the past 11 months, however, and is back up above the $25 per share mark once again. There even was a bullish cross of the 21- and 50-day exponential moving averages (EMAs) in late February 2013 and both EMA's are still rising, with EA sitting well above the pair. While things look very bullish at first glance, doing a little bit of homework reveals that the "smart money" is already distributing their holding to latecomers, with the likely outcome being a near-term correction – probably during the month of August 2013. Here's a closer look now. |
|
| Figure 1. The so-called "smart money" has been gradually lightening up on their EA positions since March 2013. The stock is vulnerable to a near term decline to at least its 50-day ema. |
| Graphic provided by: TradeStation. |
| |
| EA beat its second quarter 2013 earnings expectations by a full 31%, but the company still lost $.50 per share for the quarter, a fundamental dynamic that does not appear to bode well for the company in the near term. I was thinking about this rather unexpected loss and it got me thinking about some of the big issues facing the global economy, one of which is the rate at which new technologies are destroying jobs at a rate faster than new industries can replace them. Another issue, one of more concern to EA management is the proliferation of free electronic gaming apps and platforms and wondered if EA's loss had something to do with this seemingly unstoppable trend. You know the general idea here – they offer you a free, limited-functionality game in hopes of getting you to pay good money for a full, unrestricted version. But what about the little games that come on a lot of smart phones – maybe people are just fine with those, willing to spend a little time with them, but unwilling to make the major investment of time and/or funds to commit to a "gamer" lifestyle. One of my family members (long retired) spends three to four hours daily with gaming, and most of it is done on a home PC with hugely complex, interactive virtual reality games that only cost a few dollars each. If this is a preview of consumer preferences regarding electronic gaming, the long term earnings growth rates for companies like EA might not be something to write home about. |
|
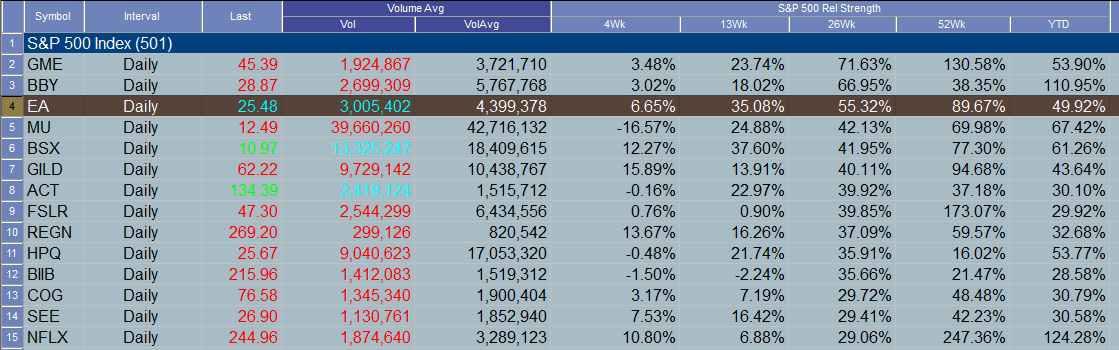
| Figure 2. EA has excellent relative strength performance when compared to the S&P 500 index over the past 4-, 13-, 26- and 52-week periods and is also up by nearly 90% YTD. |
| Graphic provided by: TradeStation. |
| Graphic provided by: TradeStation Radar Screen. |
| |
| Regardless of what the future holds, in the "here and now" the smart money has been gradually distributing their shares to latecomers since March 2013, not long after that previously mentioned bullish moving average crossover occurred. There have been several tradable swing moves since then, with several of them launching near the red 50-day EMA support line. So, really, why mess with success? The entire US market is nearing a key "rollover" point, one that should result in at least a 5-6% correction between now and mid-September 2013; the safest way to play EA now is this: 1. If you're already long EA and are sitting on healthy open profits, consider scaling out now (along with the "smart money") and get back into cash. 2. Should the anticipated correction hit soon, watch to see if EA meets its 50-day EMA after a quick, violent plunge or if it declines more gradually. If you see that it's a gradual pullback, you may be able to get in on a 20-day cycle low bottom that is poised to turn higher, offering a decent long entry point for swing and/or covered call traders. Shorting EA here looks too risky because it's a darling stock among fundamental analysts and because of its better than expected earnings release of last week. So, having the ability to be patient appears to be the first consideration for EA bulls. Now, if EA hits its 50-day EMA with a 'thud' and it doesn't bounce much but instead crashes below that line, then plan on being patient again, this time looking for a low risk entry point near the blue 200-day EMA instead – note how the latest open gap coincides with the blue 200-day EMA – this should be a "no brainer" area in which to expect bulls to come to the rescue of EA. However you choose to play EA in the weeks ahead, be sure to keep your account risk small and your portfolio well-diversified. Trade wisely until we meet here again. |
Freelance financial markets writer and online publisher of the Trendzetterz.com S&P 500 Weekly Forecast service.
| Title: | Market consultant and writer |
| Company: | Trendzetterz |
| Address: | 81 Hickory Hollow Drive |
| Crossville, TN 38555 | |
| Phone # for sales: | 904-303-4814 |
| Website: | trendzetterz.com |
| E-mail address: | support@trendzetterz.com |
Traders' Resource Links | |
| Trendzetterz has not added any product or service information to TRADERS' RESOURCE. | |
Click here for more information about our publications!
Comments
Date:�07/31/13Rank:�5Comment:�

Request Information From Our Sponsors
- StockCharts.com, Inc.
- Candle Patterns
- Candlestick Charting Explained
- Intermarket Technical Analysis
- John Murphy on Chart Analysis
- John Murphy's Chart Pattern Recognition
- John Murphy's Market Message
- MurphyExplainsMarketAnalysis-Intermarket Analysis
- MurphyExplainsMarketAnalysis-Visual Analysis
- StockCharts.com
- Technical Analysis of the Financial Markets
- The Visual Investor
- VectorVest, Inc.
- Executive Premier Workshop
- One-Day Options Course
- OptionsPro
- Retirement Income Workshop
- Sure-Fire Trading Systems (VectorVest, Inc.)
- Trading as a Business Workshop
- VectorVest 7 EOD
- VectorVest 7 RealTime/IntraDay
- VectorVest AutoTester
- VectorVest Educational Services
- VectorVest OnLine
- VectorVest Options Analyzer
- VectorVest ProGraphics v6.0
- VectorVest ProTrader 7
- VectorVest RealTime Derby Tool
- VectorVest Simulator
- VectorVest Variator
- VectorVest Watchdog