HOT TOPICS LIST
- MACD
- Fibonacci
- RSI
- Gann
- ADXR
- Stochastics
- Volume
- Triangles
- Futures
- Cycles
- Volatility
- ZIGZAG
- MESA
- Retracement
- Aroon
INDICATORS LIST
LIST OF TOPICS
PRINT THIS ARTICLE
by Koos van der Merwe
On July 25, 2013, CBS Corporation announced that its Board of Directors has expanded its share repurchase program.
Position: Hold
Koos van der Merwe
Has been a technical analyst since 1969, and has worked as a futures and options trader with First Financial Futures in Johannesburg, South Africa.
PRINT THIS ARTICLE
ELLIOTT WAVE
Going For CBS Corporation
07/31/13 05:39:14 PMby Koos van der Merwe
On July 25, 2013, CBS Corporation announced that its Board of Directors has expanded its share repurchase program.
Position: Hold
| Since the share repurchase program was initiated in January 2011, CBS has returned $3.75 billion of value to its shareholders. The Board also approved a quarterly dividend on the company's stock of $.12 per share payable on October 1, 2013 to shareholders of record on September 10, 2013. |

|
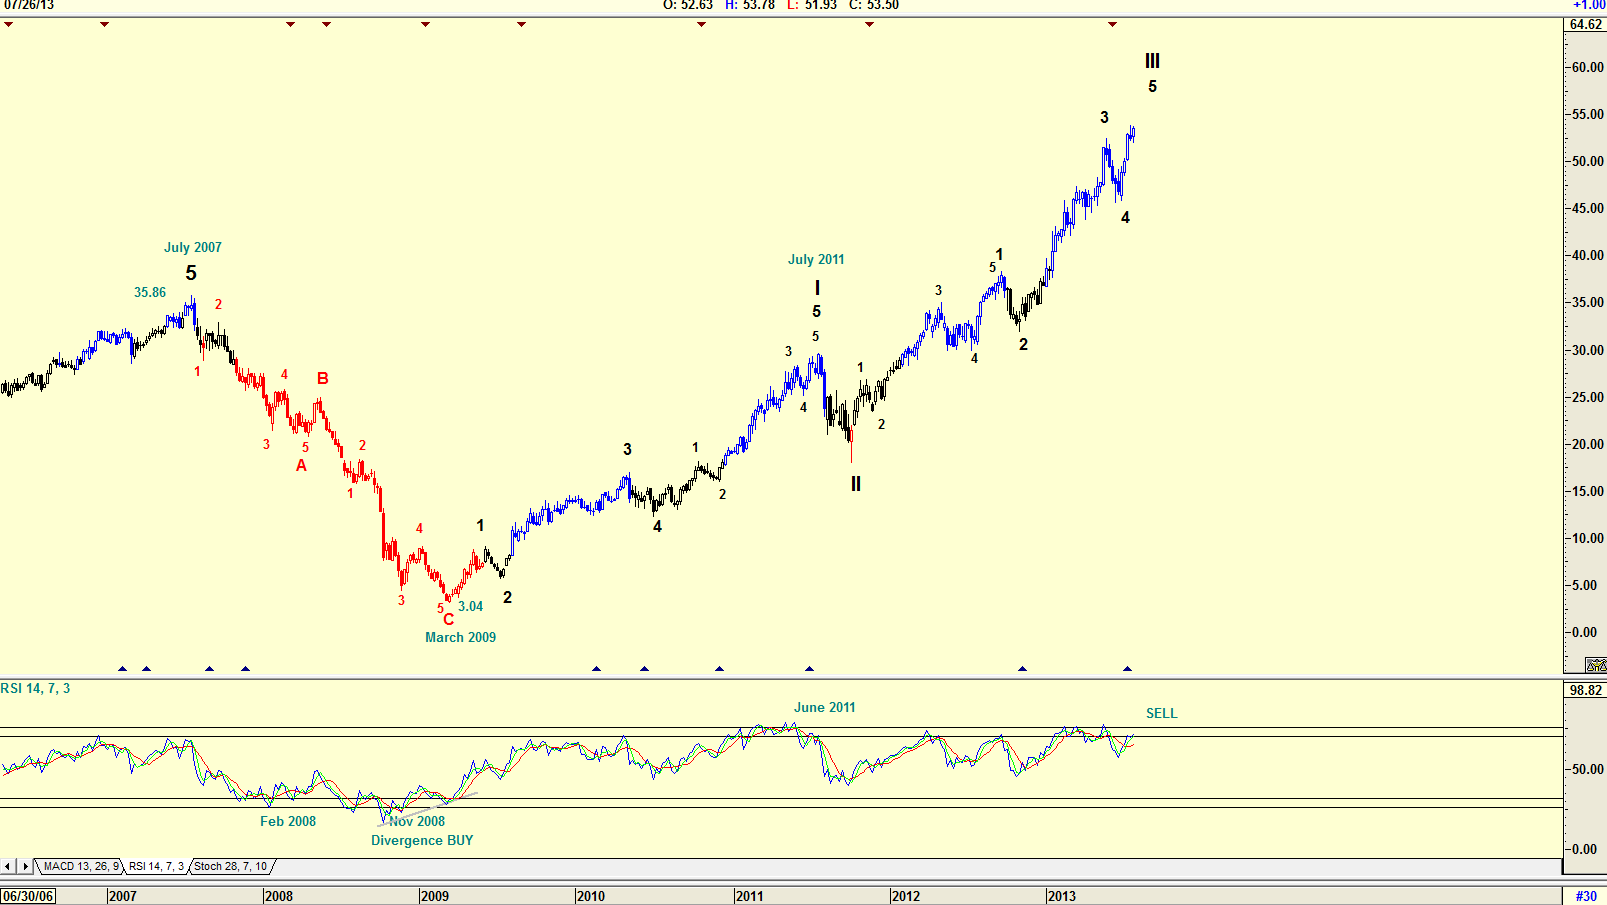
| Figure 1. Weekly chart showing rise of share price. |
| Graphic provided by: AdvancedGET. |
| |
| The weekly chart in Figure 1 is of an Elliott Wave count that shows how the share price fell from $35.86 in July 2007 to a low of $3.04 by March 2009, a drop that would have discouraged any future investor. The RSI indicator gave a buy signal in February 2008 that failed. It gave a second buy signal in November 2008, and it was only the divergence buy of March 2009 that attracted attention. In June 2011 the RSI gave a sell signal, and the share price only fell in a WAVE II correction in July 2011. Any investor would have been cautious. With an RSI sell signal showing, one would definitely not be a buyer even with the expanded repurchase program. |

|
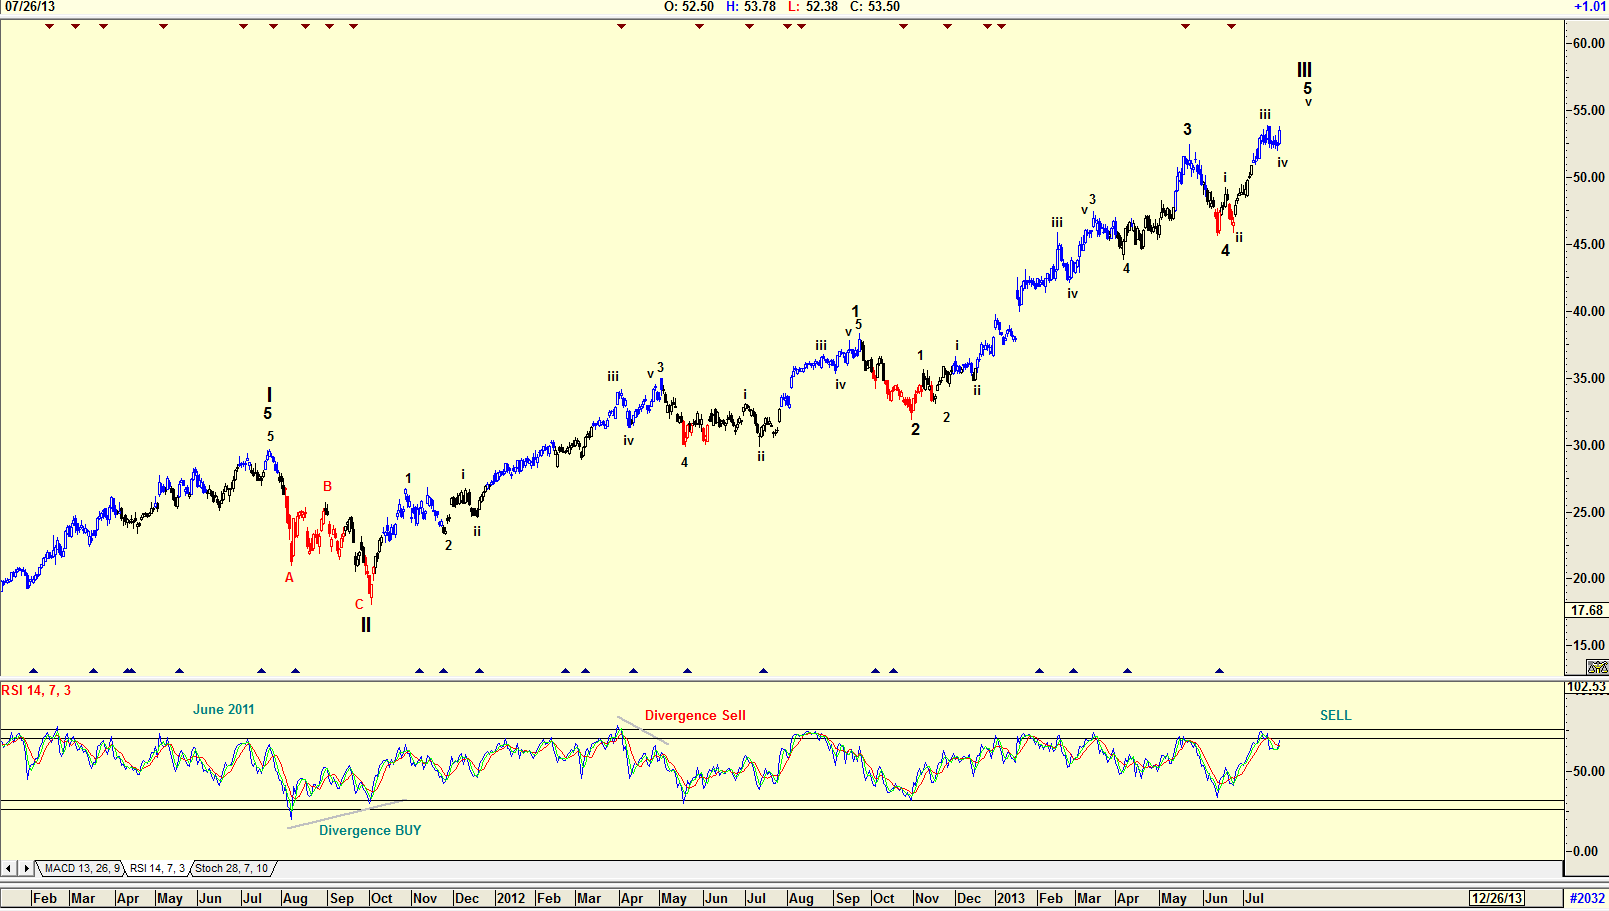
| Figure 2. Daily chart showing current position and forecast. |
| Graphic provided by: AdvancedGET. |
| |
| Figure 2 shows a daily chart with an Elliott Wave count, suggesting that the share price could be in a wave v of a Wave 5 of a WAVE III. With the RSI having given so many divergence buys and sells it is very probable that another divergence sell signal could be given in the near future, possibly only after September 10, 2013, the day after record day. |

|
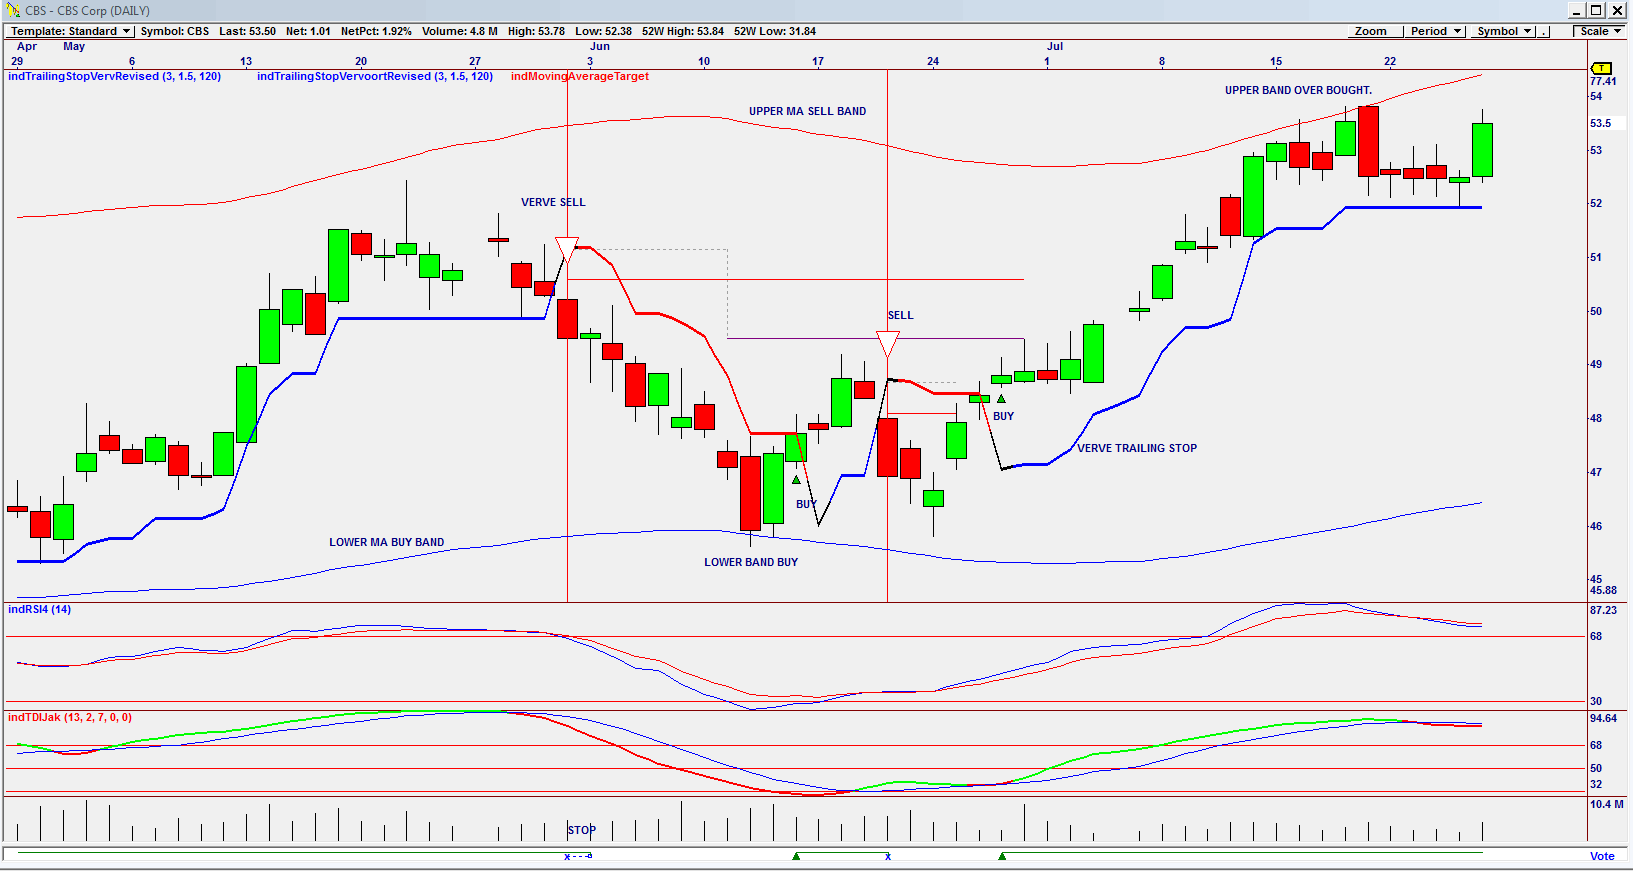
| Figure 3. Omnitrader daily chart is not showing a buy signal at current price. |
| Graphic provided by: Omnitrader. |
| |
| The chart in Figure 3 is an Omnitrader chart with the vote line showing the buy and stop loss signals. The chart is showing the vote line is in buy mode. But because it is hugging the upper MA sell band, the possibility of a sell signal is close. The upper and lower MA bands are a 20 period moving average band plotted 50% positive. The bands give a target suggestion to the movement of the price. Note that both indicators, the 14-period RSI and TDJak are both giving sell signals. Yes, collecting a dividend does look inviting, and the movement in the share price even more inviting, but I would not be a buyer at the moment. It is a share on my watch list though, and once a correction has occurred and only when I receive a new Omnitrader buy would I buy. |
Has been a technical analyst since 1969, and has worked as a futures and options trader with First Financial Futures in Johannesburg, South Africa.
| Address: | 3256 West 24th Ave |
| Vancouver, BC | |
| Phone # for sales: | 6042634214 |
| E-mail address: | petroosp@gmail.com |
Click here for more information about our publications!
PRINT THIS ARTICLE

Request Information From Our Sponsors
- VectorVest, Inc.
- Executive Premier Workshop
- One-Day Options Course
- OptionsPro
- Retirement Income Workshop
- Sure-Fire Trading Systems (VectorVest, Inc.)
- Trading as a Business Workshop
- VectorVest 7 EOD
- VectorVest 7 RealTime/IntraDay
- VectorVest AutoTester
- VectorVest Educational Services
- VectorVest OnLine
- VectorVest Options Analyzer
- VectorVest ProGraphics v6.0
- VectorVest ProTrader 7
- VectorVest RealTime Derby Tool
- VectorVest Simulator
- VectorVest Variator
- VectorVest Watchdog
- StockCharts.com, Inc.
- Candle Patterns
- Candlestick Charting Explained
- Intermarket Technical Analysis
- John Murphy on Chart Analysis
- John Murphy's Chart Pattern Recognition
- John Murphy's Market Message
- MurphyExplainsMarketAnalysis-Intermarket Analysis
- MurphyExplainsMarketAnalysis-Visual Analysis
- StockCharts.com
- Technical Analysis of the Financial Markets
- The Visual Investor
