

HOT TOPICS LIST
- MACD
- Fibonacci
- RSI
- Gann
- ADXR
- Stochastics
- Volume
- Triangles
- Futures
- Cycles
- Volatility
- ZIGZAG
- MESA
- Retracement
- Aroon
INDICATORS LIST
LIST OF TOPICS
PRINT THIS ARTICLE
by Donald W. Pendergast, Jr.
For a major stock index to rise nearly 40% in eight months is no small feat; might the time be here when the Russell 2000 index begins to retrace a third of those gains?
Position: N/A
Donald W. Pendergast, Jr.
Freelance financial markets writer and online publisher of the Trendzetterz.com S&P 500 Weekly Forecast service.
PRINT THIS ARTICLE
CHART ANALYSIS
IWM : Big Turn In The Making?
07/29/13 02:06:45 PMby Donald W. Pendergast, Jr.
For a major stock index to rise nearly 40% in eight months is no small feat; might the time be here when the Russell 2000 index begins to retrace a third of those gains?
Position: N/A
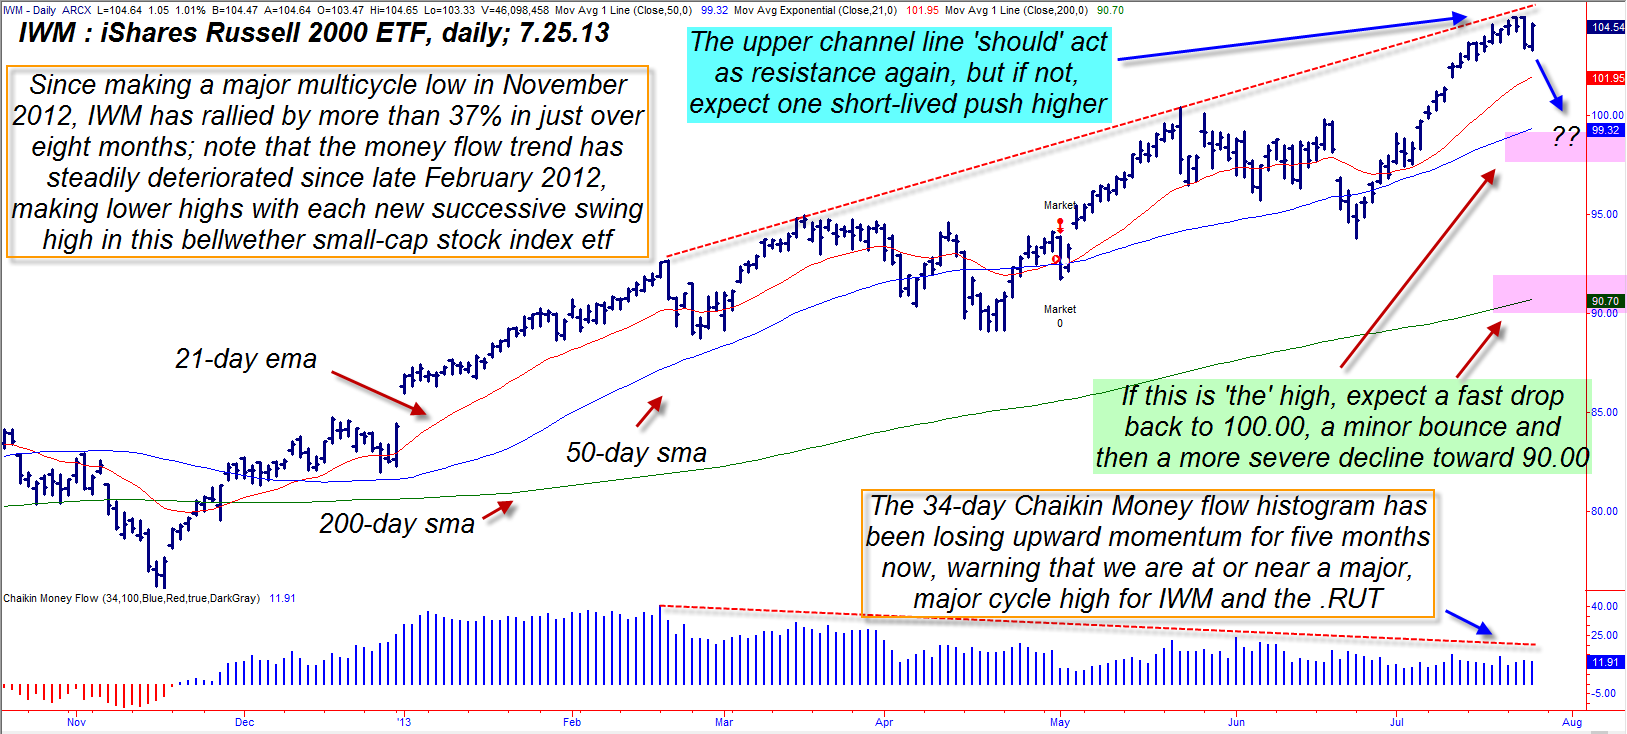
| It's been said before that "nothing exceeds like excess" and one glance at a daily/weekly chart of the Russell 2000 index (and its ETF counterpart, ticker: IWM) would seem to be a fitting visual example of that pithy saying playing out in the US stock market. With the Russell 2000 up by 38% since coming out of a major multicycle low in November 2012, there are a couple of key technical dynamics that are warning of an impending correction in this key small-cap stock index - along with the Dow 20, S&P 100/400/500 and NASDAQ Composite indexes. Here's a closer look at the daily chart of IWM (Figure 1). |
|
| Figure 1.: Can the Russell 2000 index go higher still? Yes, but the higher it goes, the more noticeable the ensuing correction will be in order to bleed the excess speculation in this niche of the US stock market. |
| Graphic provided by: TradeStation. |
| |
| The rally in small cap stocks has been nothing short of amazing, especially since the Russell 2000 index (.RIT, IWM) made a major multicycle low on November 16, 2012. IWM reached a low of 76.13 then and by July 24, 2013 had risen all the way up to 104.98. Now, for an individual stock (something like AAPL, FB or DANG) this kind of stellar performance isn't that unusual. But to have an index comprised of 2,000 stocks from a wide diversity of industry group rise in aggregate by such an amount in eight months is breathtaking. Small caps have the relative strength advantage over their mid- and large-cap counterparts (for the moment), but once the top of this long-term rally is finally in place, the correction could be swift and violent - as latecomers are left holding the bag, duped into buying at record highs from the "smart money" interests who are unloading the final portions of their small-cap holdings, running for the exits. The clearest, most irrefutable evidence that such smart money interests have been distributing their positions to less savvy market participants is revealed in the Chaikin Money flow histogram (CMF)(34) at the bottom of the chart; notice that every time IWM went on to make a new high that the money flow histogram actually made a lower high. This tells traders and investors that each subsequent rally - since the February 2013 high - has been made on lower volumes. And since professional trading makes up 80% of all stock market activity, it doesn't take much of a brain surgeon to realize that the professional buying has been steadily drying up in IWM and the Russell 2000 component stocks over the past four to five months. |
|
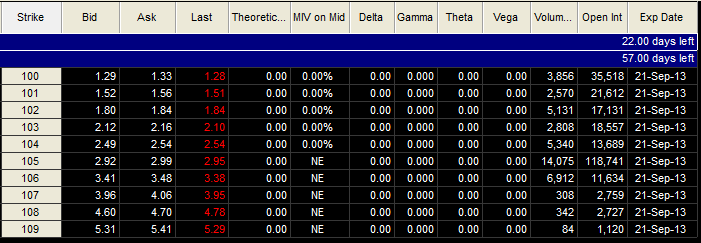
| Figure 2.: The September '13 IWM $104.00 puts look like an attractive vehicle from which to potentially profit from a near-term correction in this key small-cap stock ETF. |
| Graphic provided by: TradeStation. |
| Graphic provided by: TradeStation Options Analysis. |
| |
| For those currently log IWM or small caps (or even mid- and large-caps), it would be wise to run close trailing stops or to buy some protective put protection. Speculative bears need to sit tight until the Russell more firmly tips its hand with a large daily reversal bar, one that will take prices in the IWM back down below Wednesday's low of 103.33; that would be a low-risk signal to buy the September '13 IWM 104.00 put option, hoping to ride the IWM south toward its next support level near 100.00. This put has an extremely close bid/ask spread and heavy open interest; if filled on such a setup, look to take profits near the 100.00/100.50 area and then go back to cash, as the 100.00 level should bring in some latecomers again along with a minor bounce. Since you don't want such traders wiping out your hard won gains, it's best to take a sane, decent profit at an obvious support level rather than try to hold out for a larger and much more infrequent trend following move. Since this is a reversal-style trade, try not to risk much more than 1% of your account value on this speculative option play. Trade wisely until we meet here again. |
Freelance financial markets writer and online publisher of the Trendzetterz.com S&P 500 Weekly Forecast service.
| Title: | Market consultant and writer |
| Company: | Trendzetterz |
| Address: | 81 Hickory Hollow Drive |
| Crossville, TN 38555 | |
| Phone # for sales: | 904-303-4814 |
| Website: | trendzetterz.com |
| E-mail address: | support@trendzetterz.com |
Traders' Resource Links | |
| Trendzetterz has not added any product or service information to TRADERS' RESOURCE. | |
Click here for more information about our publications!
PRINT THIS ARTICLE

Request Information From Our Sponsors
- StockCharts.com, Inc.
- Candle Patterns
- Candlestick Charting Explained
- Intermarket Technical Analysis
- John Murphy on Chart Analysis
- John Murphy's Chart Pattern Recognition
- John Murphy's Market Message
- MurphyExplainsMarketAnalysis-Intermarket Analysis
- MurphyExplainsMarketAnalysis-Visual Analysis
- StockCharts.com
- Technical Analysis of the Financial Markets
- The Visual Investor
- VectorVest, Inc.
- Executive Premier Workshop
- One-Day Options Course
- OptionsPro
- Retirement Income Workshop
- Sure-Fire Trading Systems (VectorVest, Inc.)
- Trading as a Business Workshop
- VectorVest 7 EOD
- VectorVest 7 RealTime/IntraDay
- VectorVest AutoTester
- VectorVest Educational Services
- VectorVest OnLine
- VectorVest Options Analyzer
- VectorVest ProGraphics v6.0
- VectorVest ProTrader 7
- VectorVest RealTime Derby Tool
- VectorVest Simulator
- VectorVest Variator
- VectorVest Watchdog