

HOT TOPICS LIST
- MACD
- Fibonacci
- RSI
- Gann
- ADXR
- Stochastics
- Volume
- Triangles
- Futures
- Cycles
- Volatility
- ZIGZAG
- MESA
- Retracement
- Aroon
INDICATORS LIST
LIST OF TOPICS
PRINT THIS ARTICLE
by Donald W. Pendergast, Jr.
Shares of Healthcare Management Associates, Inc. are up by more than 150% since June 2012 and may soon be offering traders and investors a low risk pullback entry opportunity.
Position: N/A
Donald W. Pendergast, Jr.
Freelance financial markets writer and online publisher of the Trendzetterz.com S&P 500 Weekly Forecast service.
PRINT THIS ARTICLE
TECHNICAL ANALYSIS
HMA: Proportional Pullback To Support
07/26/13 04:19:05 PMby Donald W. Pendergast, Jr.
Shares of Healthcare Management Associates, Inc. are up by more than 150% since June 2012 and may soon be offering traders and investors a low risk pullback entry opportunity.
Position: N/A
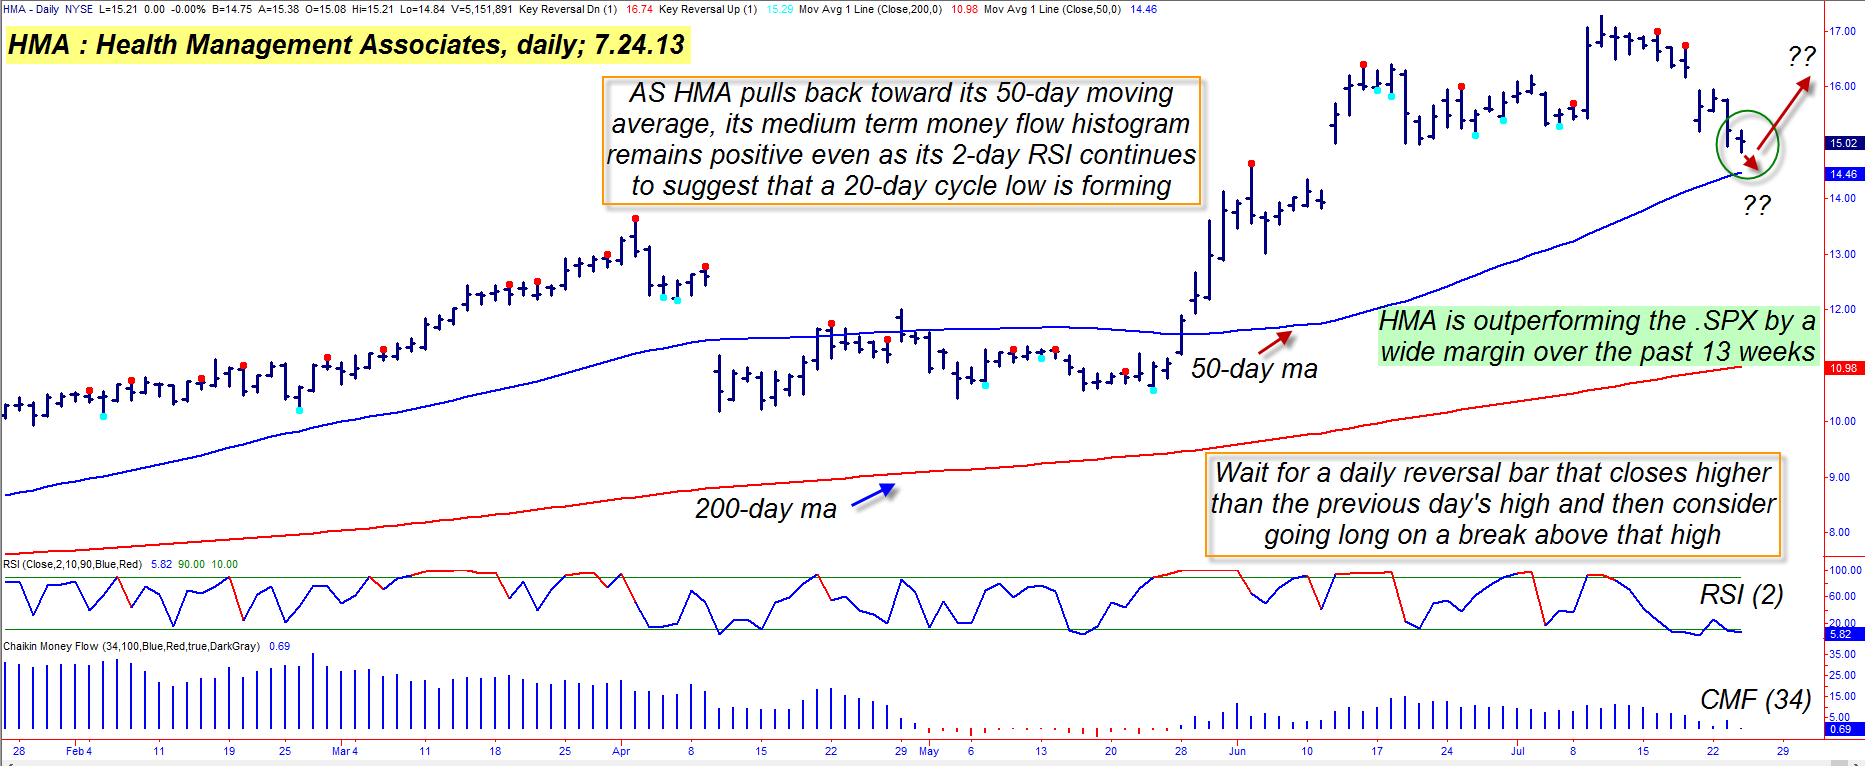
| Healthcare Management Associates, Inc. (HMA) has carved out a profitable niche in the health care sector with its various acute-care facilities in rural areas in the southeastern/southwestern United States. After making a major multicycle low at 5.92 on June 5, 2012, the stock rallied by more than 190% before peaking out at 17.28 on July 10, 2013. Not surprisingly, HMA has recently retraced a portion of those gains and now appears to be closing in on a time/price junction where the probabilities of a bullish reversal become very likely. Here's a closer look now. |
|
| Figure 1. A number of technical dynamics are all in general agreement that HMA may soon experience a bullish reversal attempt should critical support hold as its next 20-day cycle low forms. |
| Graphic provided by: TradeStation. |
| |
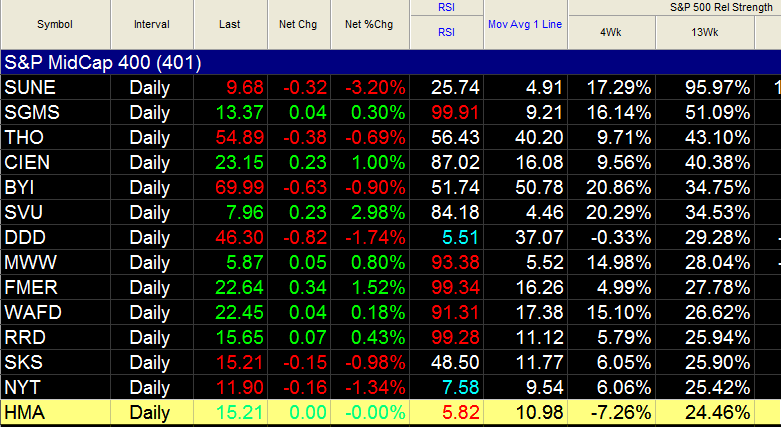
| Still holding on to open gains of better than 150% since coming out of its major June 2012 low, HMA has a variety of bullish factors converging in the same time window: 1. The stock has closed lower in nine of its last 10 trading sessions. 2. Its 34- and 89-day Chaikin Money flow histograms (CMF)34) and (CMF)(89) are still positive. 3. Its two-day RSI indicator is at a level of only 5.82 and may be confirming a 20-day cycle low in the stock. 4. The stock is trading just above its 50-day simple moving average (SMA), a key support level, one that frequently will help launch a reversal-style trade setup after a proportional pullback. 5. HMA is greatly outperforming the S&P 500 index over the past 13-, 26- and 52-week periods and is also up nearly 38% year-to-date. Taken as a whole, what all this means is that we have a stock that is significantly out-performing the major stock indexes, even as it maintains bullish money flow trends as it descends toward a widely-watched support level at the same time that it is likely ready to complete a 20-day cycle low. Basically, this is the kind of low-risk bullish pullback entry setup that mutual fund managers dream about; one that may very well offer a long entry signal within the next few trading sessions. |
|
| Figure 2. HNA's 2-day RSI indicator remains at a very low level as the stock pulls back toward its 50-day moving average; its next 20-day cycle low may be achieved very soon. |
| Graphic provided by: TradeStation. |
| Graphic provided by: TradeStation Radar Screen. |
| |
| Playing a bullish reversal in HMA would go something like this: 1. Wait for the stock to confirm that it has indeed made its final descent into its 20-day cycle low (a very regular cycle on many daily stock charts). The tip-off that the cycle low is "in" will be when a subsequent daily price bar manages to make a daily close that is higher than the close of the bar that ultimately defines the low price of the pullback into said cycle low. Simply put, wait for the low to print and then buy on strength coming up out of the cycle low. Use a buy stop order that's a few ticks above the high of the setup bar just described to get you into the trade. 2. Once in the trade, use a two- to three-bar trailing stop of the daily lows to manage the trade until final stop out; traders convinced of a larger bullish trending move may want to use a volatility trailing stop instead, using a 10-period ATR with a multiplier of two as the key inputs. 3. Selling near term puts doesn't look like a good strategy here, as the bid/ask spread on the August '13 HMA puts is just too wide to offer a trader a decent edge; just stick with stock for this swing trade. 4. Limit your account risks to no more than 1-2% on this trade and consider taking partial profits should HMA rally back up toward the 16.75/17.00 area, perhaps running a closer trailing stop once such gains (if any) are achieved. 5. Trade wisely until we meet here again. |
Freelance financial markets writer and online publisher of the Trendzetterz.com S&P 500 Weekly Forecast service.
| Title: | Market consultant and writer |
| Company: | Trendzetterz |
| Address: | 81 Hickory Hollow Drive |
| Crossville, TN 38555 | |
| Phone # for sales: | 904-303-4814 |
| Website: | trendzetterz.com |
| E-mail address: | support@trendzetterz.com |
Traders' Resource Links | |
| Trendzetterz has not added any product or service information to TRADERS' RESOURCE. | |
Click here for more information about our publications!
PRINT THIS ARTICLE

Request Information From Our Sponsors
- VectorVest, Inc.
- Executive Premier Workshop
- One-Day Options Course
- OptionsPro
- Retirement Income Workshop
- Sure-Fire Trading Systems (VectorVest, Inc.)
- Trading as a Business Workshop
- VectorVest 7 EOD
- VectorVest 7 RealTime/IntraDay
- VectorVest AutoTester
- VectorVest Educational Services
- VectorVest OnLine
- VectorVest Options Analyzer
- VectorVest ProGraphics v6.0
- VectorVest ProTrader 7
- VectorVest RealTime Derby Tool
- VectorVest Simulator
- VectorVest Variator
- VectorVest Watchdog
- StockCharts.com, Inc.
- Candle Patterns
- Candlestick Charting Explained
- Intermarket Technical Analysis
- John Murphy on Chart Analysis
- John Murphy's Chart Pattern Recognition
- John Murphy's Market Message
- MurphyExplainsMarketAnalysis-Intermarket Analysis
- MurphyExplainsMarketAnalysis-Visual Analysis
- StockCharts.com
- Technical Analysis of the Financial Markets
- The Visual Investor