HOT TOPICS LIST
- MACD
- Fibonacci
- RSI
- Gann
- ADXR
- Stochastics
- Volume
- Triangles
- Futures
- Cycles
- Volatility
- ZIGZAG
- MESA
- Retracement
- Aroon
INDICATORS LIST
LIST OF TOPICS
PRINT THIS ARTICLE
by Koos van der Merwe
When times are tough, and money is short, is buying a pizza for dinner the answer?
Position: Hold
Koos van der Merwe
Has been a technical analyst since 1969, and has worked as a futures and options trader with First Financial Futures in Johannesburg, South Africa.
PRINT THIS ARTICLE
ELLIOTT WAVE
Do You Enjoy Pizza?
07/26/13 04:14:53 PMby Koos van der Merwe
When times are tough, and money is short, is buying a pizza for dinner the answer?
Position: Hold
| Walking through a Walmart, Safeway, IGA, or any supermarket, the display of a large variety of pizzas always catches your eye. When walking down the street of a city, how often do you see a young man or woman sitting on a park bench munching a slice of pizza they bought a little way down the road? I must add, that they are delicious, and filling, and a lunch/dinner definitely worth the buy, and the share? Well, when they pay a dividend, then even a better buy. In Canada there are two pizza companies that are attracting a great deal of attention. Boston Pizza Royalties Income Fund and Pizza Pizza Royalty Corp. |

|
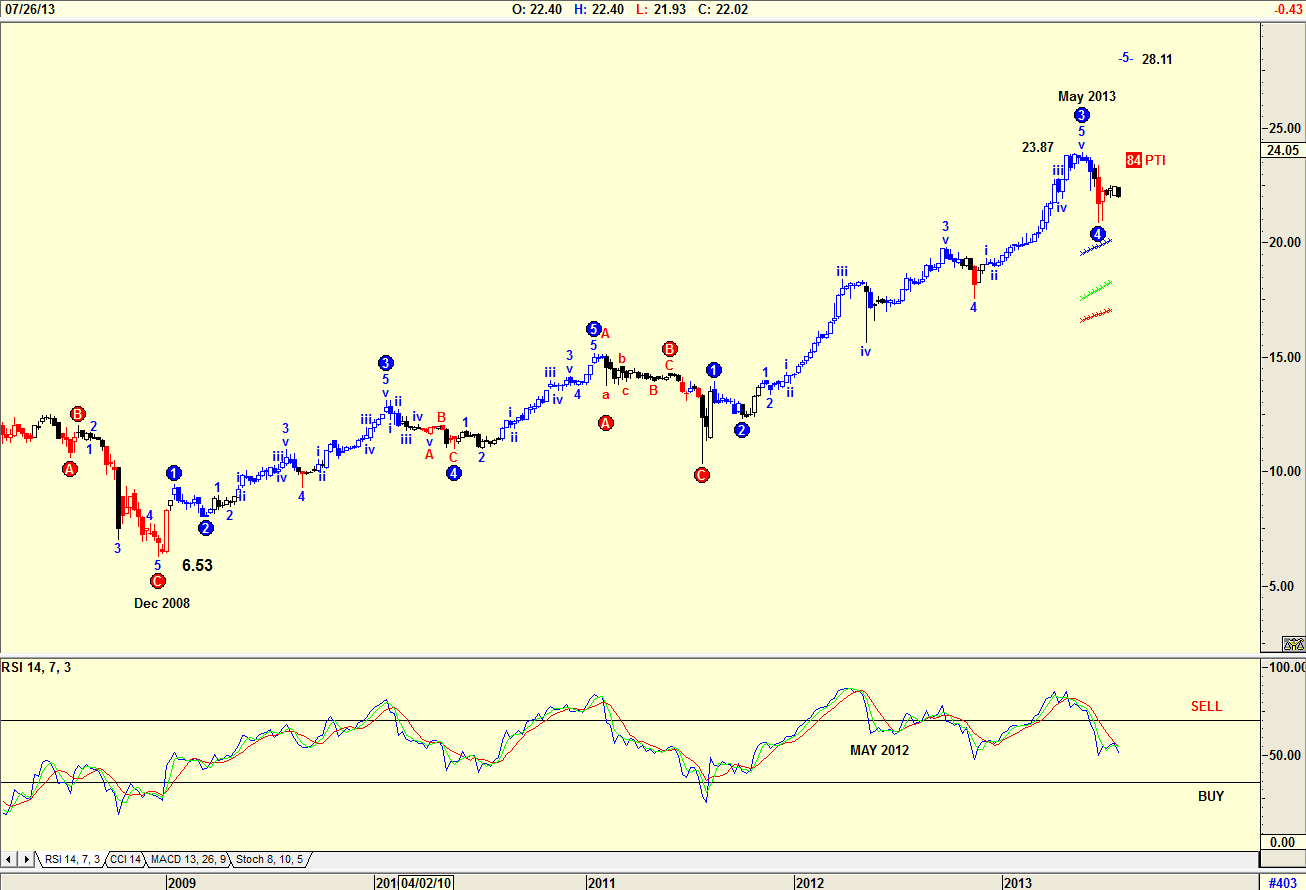
| Figure 1. Weekly chart of Boston Pizza. |
| Graphic provided by: AdvancedGET. |
| |
| The chart is Figure 1 is a weekly chart of Boston Pizza Royalties Income Fund. Note how the price rose from $6.58 in December 2008 to a high of $23.87 by May 2013. The Elliott Wave count shown on the chart is an Advanced GET Wave count suggesting that the share price is completing a WAVE 4 correction with a PTI (Probability Index) of 84. The count is suggesting a target of $28.11 as a Wave 5 top. Note also how the share price ignored the RSI sell signal given in May 2012. |

|
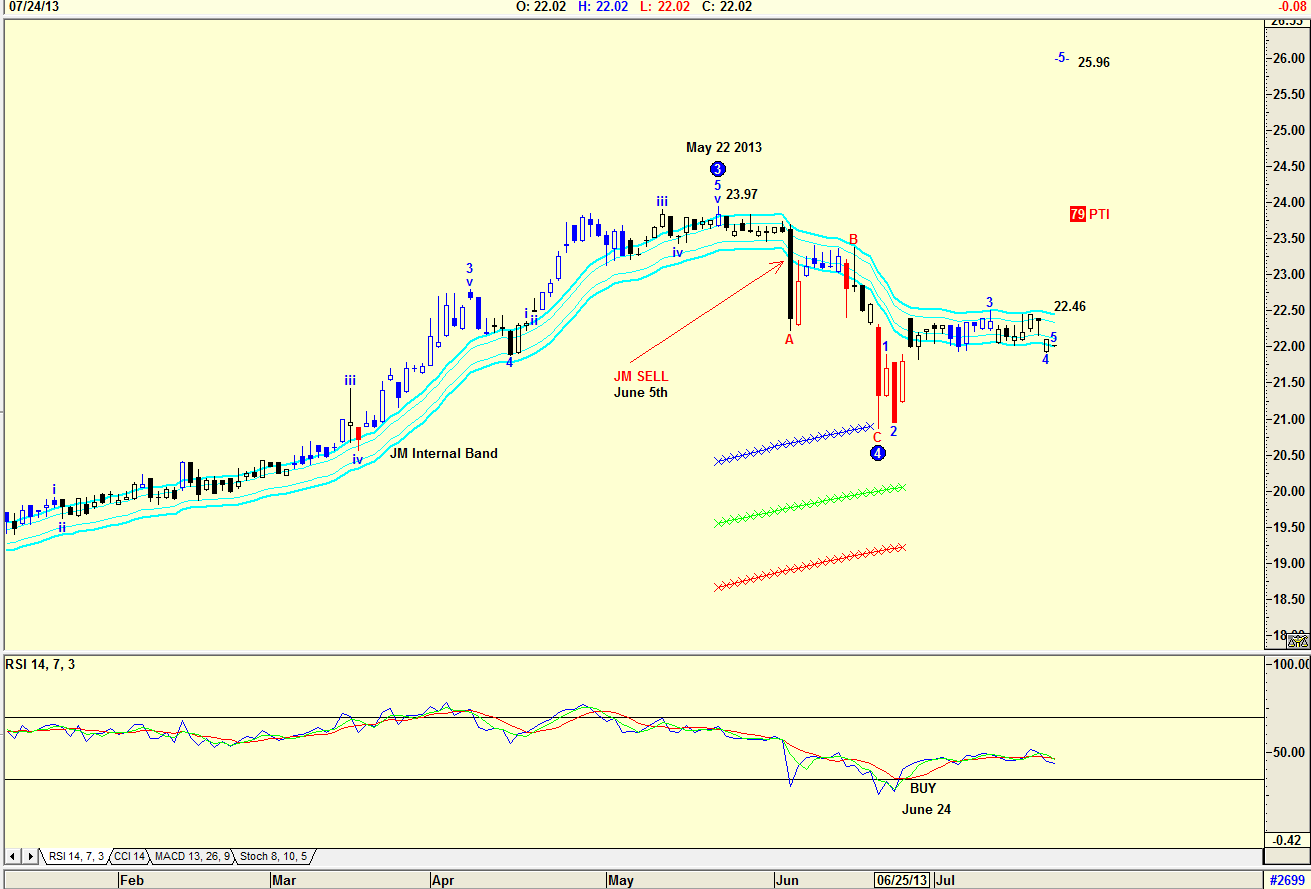
| Figure 2. Daily chart of Boston Pizza. |
| Graphic provided by: AdvancedGET. |
| |
| The daily chart in Figure 2 shows an Elliott Wave count with the Wave 4 completed and a projected Wave 5 high of $25.96 with a PTI of 79. The RSI index has given a buy signal on June 24, 2013. Do note the JM Internal Band sell signal on June 5, 2013. The JM Internal band is a 15-period simple moving average offset by 2% positive and 2% negative. A move above the upper band is a buy signal, and a move below the lower band, a sell signal. At the moment, the share price has not given a buy signal. The chart is suggesting that a buy signal above the upper band could be $22.46. One big attraction to the share is that as the company is paying a monthly dividend of 10 cents per share, a yield of 5.54% at the current price. |

|
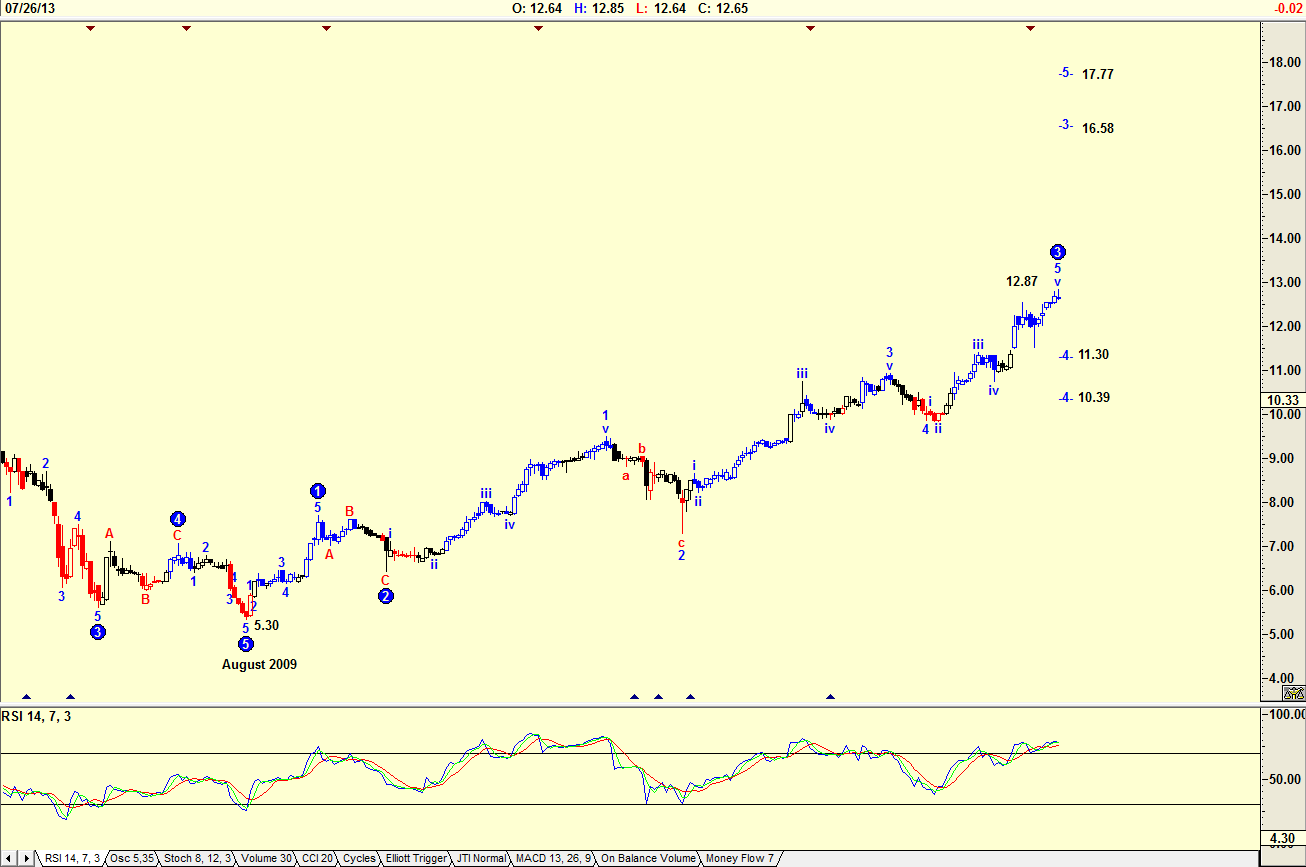
| Figure 3. Weekly chart of Pizza Pizza. |
| Graphic provided by: AdvancedGET. |
| |
| The chart in Figure 3 is a weekly chart of Pizza Pizza, with an Advanced GET Elliott Wave count suggesting that the share price is in a Wave 3, with a Wave 4 correction to come. The chart is suggesting that Wave 3 may not be complete, and suggests a possible target of $16.58. The RSI indicator is at overbought levels, and should it give a sell signal, the price could fall in a wave 4 to either $11.30 or $10.39. Once the correction has occurred, the share price could rise in a wave 5 to $17.77. |

|
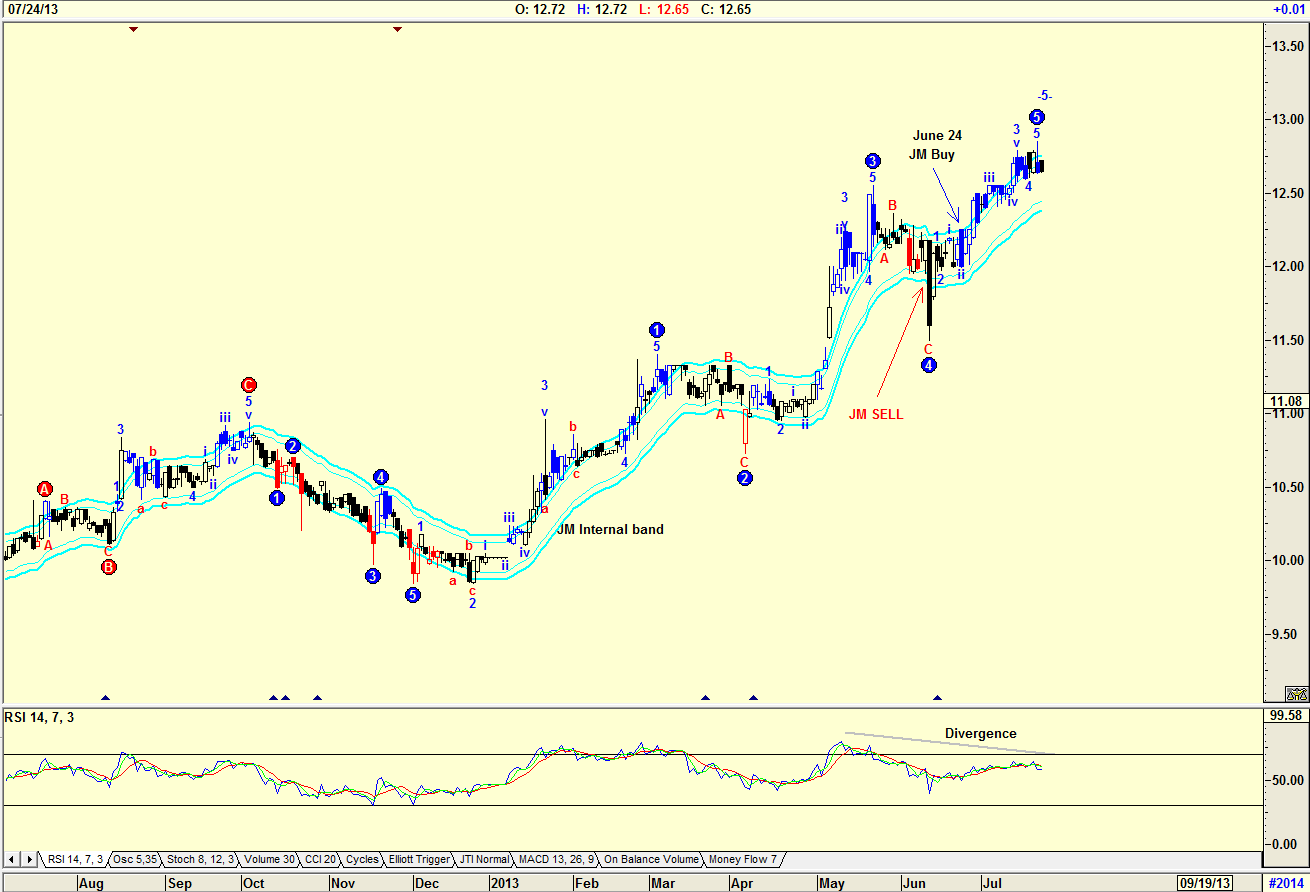
| Figure 4. Daily chart of Pizza Pizza. |
| Graphic provided by: AdvancedGET. |
| |
| Figure 4 is a daily chart of Pizza Pizza with an Advanced GET Elliott Wave count suggesting that a wave 5 could be topping out. Do note the divergence sell signal given by the RSI Indicator. A divergence sell is where the share price rises but the RSI indicator falls. The JM Internal Band indicator shows that the share price is still in a buy mode. With a seven cents per month dividend, the share price is offering a yield of 6.18%. Yes, both shares have proved to be long-term hold winners. With their yields having been constant over the years and with charts suggesting higher price in the future, one should wait for the expected correction and then buy, buy, buy as the share price starts rising again. Conservative investors can wait for a buy signal given by the JM Internal Band indicator. |
Has been a technical analyst since 1969, and has worked as a futures and options trader with First Financial Futures in Johannesburg, South Africa.
| Address: | 3256 West 24th Ave |
| Vancouver, BC | |
| Phone # for sales: | 6042634214 |
| E-mail address: | petroosp@gmail.com |
Click here for more information about our publications!
PRINT THIS ARTICLE

Request Information From Our Sponsors
- StockCharts.com, Inc.
- Candle Patterns
- Candlestick Charting Explained
- Intermarket Technical Analysis
- John Murphy on Chart Analysis
- John Murphy's Chart Pattern Recognition
- John Murphy's Market Message
- MurphyExplainsMarketAnalysis-Intermarket Analysis
- MurphyExplainsMarketAnalysis-Visual Analysis
- StockCharts.com
- Technical Analysis of the Financial Markets
- The Visual Investor
- VectorVest, Inc.
- Executive Premier Workshop
- One-Day Options Course
- OptionsPro
- Retirement Income Workshop
- Sure-Fire Trading Systems (VectorVest, Inc.)
- Trading as a Business Workshop
- VectorVest 7 EOD
- VectorVest 7 RealTime/IntraDay
- VectorVest AutoTester
- VectorVest Educational Services
- VectorVest OnLine
- VectorVest Options Analyzer
- VectorVest ProGraphics v6.0
- VectorVest ProTrader 7
- VectorVest RealTime Derby Tool
- VectorVest Simulator
- VectorVest Variator
- VectorVest Watchdog
