HOT TOPICS LIST
- MACD
- Fibonacci
- RSI
- Gann
- ADXR
- Stochastics
- Volume
- Triangles
- Futures
- Cycles
- Volatility
- ZIGZAG
- MESA
- Retracement
- Aroon
INDICATORS LIST
LIST OF TOPICS
PRINT THIS ARTICLE
by Donald W. Pendergast, Jr.
Up by more than 350% since August 2012, shares of Netflix may soon make it back up to their 2011 pre-crash highs.
Position: N/A
Donald W. Pendergast, Jr.
Freelance financial markets writer and online publisher of the Trendzetterz.com S&P 500 Weekly Forecast service.
PRINT THIS ARTICLE
MOMENTUM
Netflix: Red Hot And Still Rising
07/25/13 03:23:49 PMby Donald W. Pendergast, Jr.
Up by more than 350% since August 2012, shares of Netflix may soon make it back up to their 2011 pre-crash highs.
Position: N/A
| When a company begins to either create a new market niche and/or completely overwhelm its existing competition in terms of market share, its stock price will typically start to go into a long-term rally, one that seems almost superhuman in terms of its ability to shrug off bad economic and political news, always able to quickly rebound and move on up to ever higher highs. Since the summer of 2012, Netflix (NFLX) has manifested just that kind of price action, and from the looks of its daily chart, still appears to have what it takes to meet or even exceed its 2011 high-water mark of 304.79. Here's a closer look now. |

|
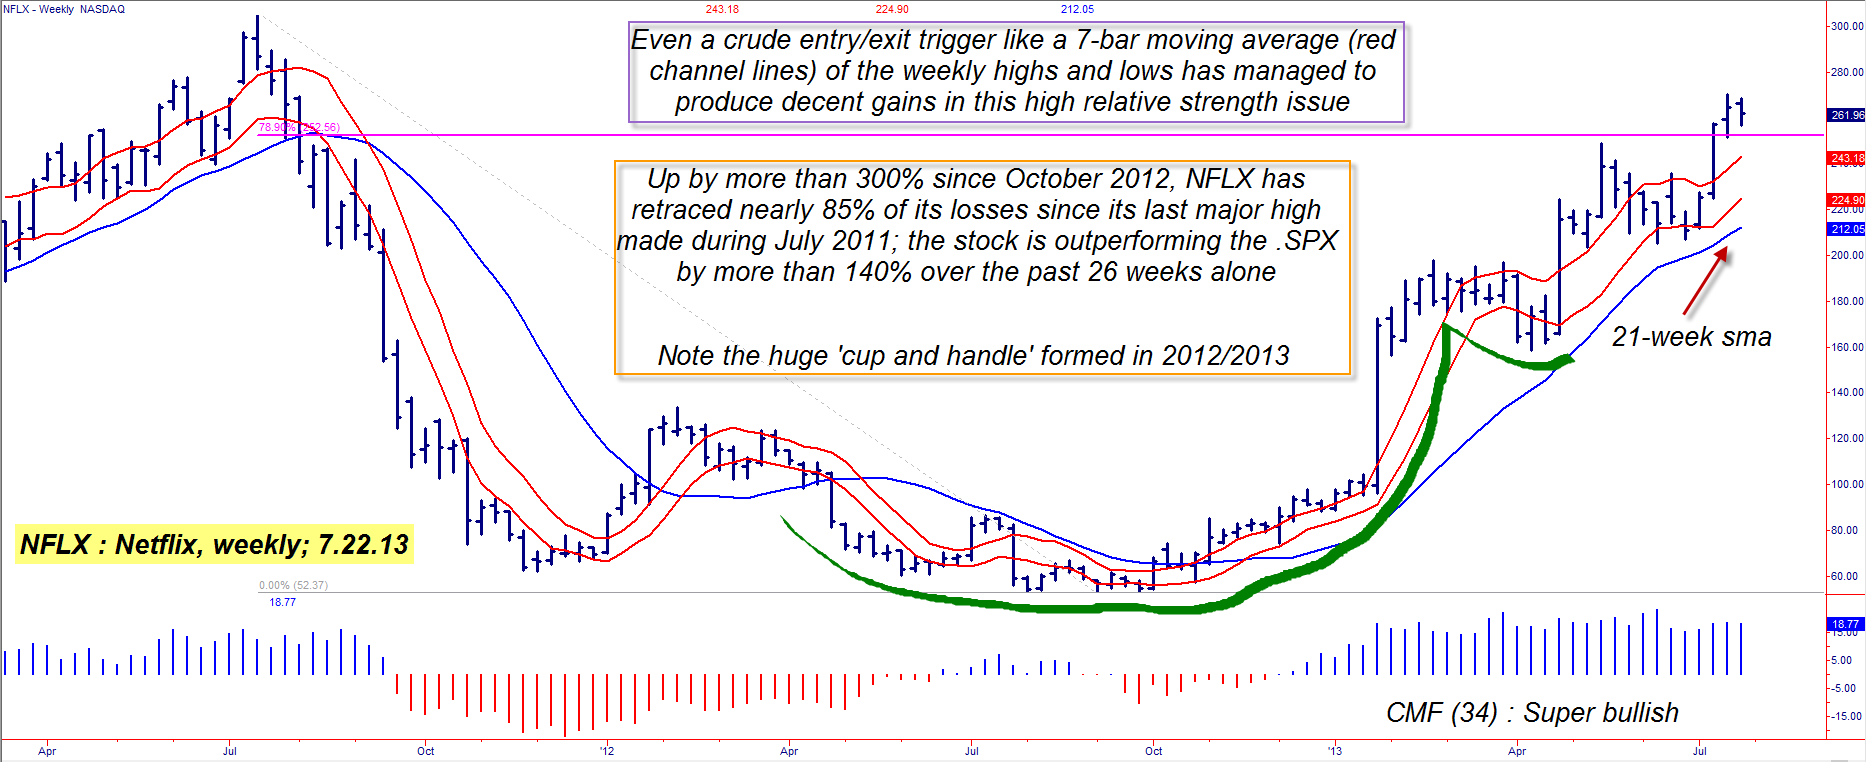
| Figure 1. Netflix's weekly 'cup and handle' pattern resolved with a massive bullish breakout; the stock now appears to have its sights set on making a possible run up to its July 2011 high water mark of 304.79. |
| Graphic provided by: TradeStation. |
| |
| Any time you have a stock that has beaten its earnings estimates for 11 consecutive quarters, it's no surprise to see that the stock will likely have had substantial, sustained gains over that timespan. NFLX has indeed beaten the Street's earnings estimates for 11 consecutive quarters – including the most recent one. Now, of course, no stock was immune from the severe summer decline of 2011, and that included NFLX; but over the past 11 months the stock has gained more than 350% and is now getting high enough to make a fresh assault on its summer 2011 high of 304.79. One look at its weekly chart is enough to convince even a diehard bear that NFLX is in a runaway bull market, one that still has: 1. Positive medium-term money flow. 2. Massive bullish momentum. 3. Solid long-term sales/earnings growth prospects. 4. Superior relative strength vs. the major US stock indexes. Interestingly, the huge cup & handle formation (Figure 1) of 2012/2013 has played out in near-textbook fashion, with a substantial amount of gains for NFLX since the pattern resolved itself with a massive weekly breakout in late April 2013. Another item of interest is the crude entry/exit trigger mechanism overlaid on the weekly chart; the red channel boundaries depict the seven-period simple moving average (SMA) of the weekly highs and lows. A buy is signaled on a break above the red line and price is above the blue 21-week SMA and an exit is triggered when prices break back below the lower red channel line. The system can also go short on a break below the lower red channel line as long as prices are below the 21-week SMA at the time of the break. It's a dirt-simple system, one that you can create for free in virtually all modern charting packages, by the way. |

|
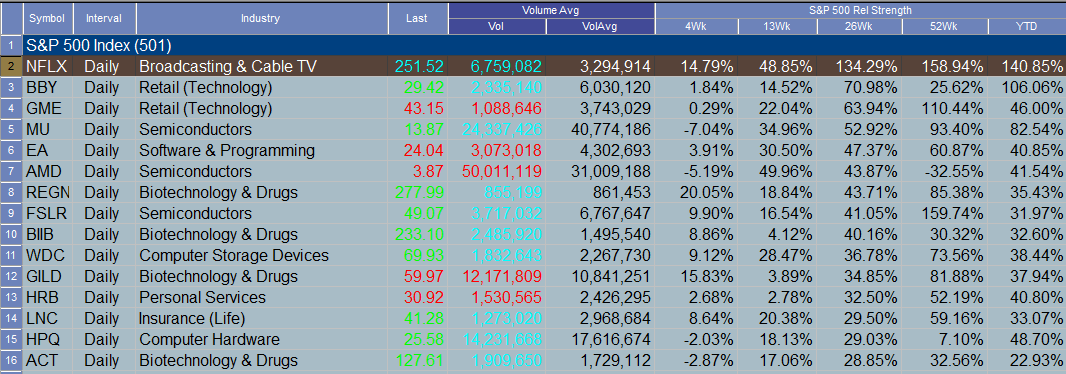
| Figure 2. NFLX is far outpacing the gains of its S&P 500 index peers (against the .SPX) over the past 26 weeks. |
| Graphic provided by: TradeStation. |
| Graphic provided by: TradeStation Radar Screen. |
| |
| NFLX has the highest 26-week relative strength ranking vs. the .SPX of all 500 stocks in the S&P 500 index, and given the massive upward momentum in this stock, the safest way to play it is to drop down to a daily chart, buying every two-period RSI pullback to support until the July 2011 highs have been hit. You could even use a 60- to 120- minute chart and do the same thing, looking to hold for two to four-day swing moves higher. Conservative traders can also try the covered call route, but it might be wise to wait for a bit more of a pullback before looking to put on a CC as the stock is a bit toppy looking on its daily chart at the moment. Use a call option with at least four to eight weeks of time value and consider using the 21-day exponential moving average (EMA) as your trailing stop loss for the life of the position, risking no more than 1-2% of your account value, no matter how bullish you are on NFLX at this time. Trade wisely until we meet here again. |
Freelance financial markets writer and online publisher of the Trendzetterz.com S&P 500 Weekly Forecast service.
| Title: | Market consultant and writer |
| Company: | Trendzetterz |
| Address: | 81 Hickory Hollow Drive |
| Crossville, TN 38555 | |
| Phone # for sales: | 904-303-4814 |
| Website: | trendzetterz.com |
| E-mail address: | support@trendzetterz.com |
Traders' Resource Links | |
| Trendzetterz has not added any product or service information to TRADERS' RESOURCE. | |
Click here for more information about our publications!
PRINT THIS ARTICLE

|

Request Information From Our Sponsors
- VectorVest, Inc.
- Executive Premier Workshop
- One-Day Options Course
- OptionsPro
- Retirement Income Workshop
- Sure-Fire Trading Systems (VectorVest, Inc.)
- Trading as a Business Workshop
- VectorVest 7 EOD
- VectorVest 7 RealTime/IntraDay
- VectorVest AutoTester
- VectorVest Educational Services
- VectorVest OnLine
- VectorVest Options Analyzer
- VectorVest ProGraphics v6.0
- VectorVest ProTrader 7
- VectorVest RealTime Derby Tool
- VectorVest Simulator
- VectorVest Variator
- VectorVest Watchdog
- StockCharts.com, Inc.
- Candle Patterns
- Candlestick Charting Explained
- Intermarket Technical Analysis
- John Murphy on Chart Analysis
- John Murphy's Chart Pattern Recognition
- John Murphy's Market Message
- MurphyExplainsMarketAnalysis-Intermarket Analysis
- MurphyExplainsMarketAnalysis-Visual Analysis
- StockCharts.com
- Technical Analysis of the Financial Markets
- The Visual Investor
