HOT TOPICS LIST
- MACD
- Fibonacci
- RSI
- Gann
- ADXR
- Stochastics
- Volume
- Triangles
- Futures
- Cycles
- Volatility
- ZIGZAG
- MESA
- Retracement
- Aroon
INDICATORS LIST
LIST OF TOPICS
PRINT THIS ARTICLE
by Billy Williams
Institutional traders have enormous advantages over the individual trader but there is one advantage the retail trader has that trumps all of them.
Position: Buy
Billy Williams
Billy Williams has been trading the markets for 27 years, specializing in momentum trading with stocks and options.
PRINT THIS ARTICLE
TECHNICAL ANALYSIS
How to Find New Stock Trends
07/25/13 03:09:47 PMby Billy Williams
Institutional traders have enormous advantages over the individual trader but there is one advantage the retail trader has that trumps all of them.
Position: Buy
| Marty Schwartz, a famed daytrader and author of the book, "Pit Bull", once remarked that in his days as an analyst he was a strong fundamentalist but it wasn't until he became a full-time trader that he got rich as a technician. The merits and short-comings of each approach are commonly discussed with fundamentalists on one side spouting about the underlying economics of a stock or macro-strategy with market technicians on the other side, pointing out that price action and trends are where the money is. Both are right and wrong but one thing remains to be sure – fundamentally good stocks reveal themselves through price and if you can spot the signs, you can get in early on a potential runaway stock. In the universe of the stock market, there exists the giants of the investment world and those are big institutional traders. This elite group is made up of pensions, hedge funds, mutual funds, and investment banks who command trillions of investment capital. They are the apex-predators of Wall Street due to the immense size of investment capital that they control. |

|
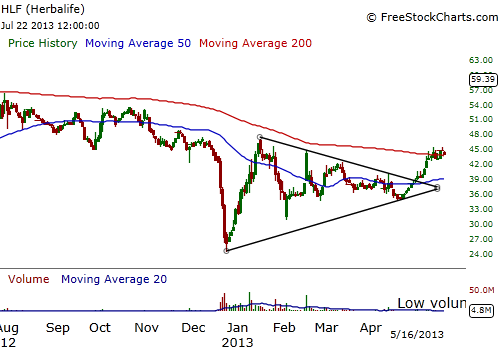
| Figure 1. Herbal Life tanked near the end of 2012 on news that its business model was declared a ponzi scheme by a hedge fund manager. The stock plunged and then began to form a bottom, then a base pattern just under the 50-day and 200-day SMA. |
| Graphic provided by: www.freestockcharts.com. |
| |
| In addition to trillions of dollars that they control, they also employ the best and brightest as traders, analysts, and fund managers from the best universities in the world. The retail trader (you) exists on the lowest rung of the investment hierarchy and the public mainly exist as prey for the predators that operate on Wall Street. You, however, have one glaring advantage that the big institutions do not and that is that you can watch for signs in a stock's price action and step in front of Wall Street and its machine just before they buy a company's stock in bulk. |

|
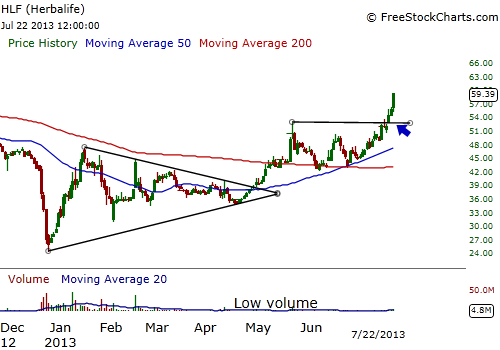
| Figure 2. As price climbed above its moving averages, it formed a double bottom as the 50-day SMA crossed up through the 200-day SMA. Later, HLF broke out on almost twice the trade volume than its 20-day average volume, signaling a buy signal. At this juncture, HLF could be in the beginning stages of a major bull run as the overall market climbs higher. |
| Graphic provided by: www.freestockcharts.com. |
| |
| Fundamentally strong stocks attract the attention of the big institutions. With billions under management, they have to deploy that capital in the best investments they have. But, often there aren't enough good companies to invest in. They have more money than they do opportunities. So, they invest in many new upcoming stocks almost in a herd-like mentality. Stocks slowly come under accumulation as their traders try to buy in odd-lots – 10,458 share here, 23,187 shares there – in order to avoid attracting attention to what they are doing so they can buy their shares at a good bargain. |
| However, when the rest of Wall Street finally catches on, then everyone tries to buy at the same time, which causes price to explode higher. Volume begins to rise and as it does, various chart patterns begin to form – cup & handle, flat base, double bottom patterns – to name a few. And, when price and volume explode at the right moment, then you can step in front of the big institutions as they take the stock higher. For you, as a trader, it is more profitable to catch an early trend and ride the momentum caused by the big players than to fight against them. |
Billy Williams has been trading the markets for 27 years, specializing in momentum trading with stocks and options.
| Company: | StockOptionSystem.com |
| E-mail address: | stockoptionsystem.com@gmail.com |
Traders' Resource Links | |
| StockOptionSystem.com has not added any product or service information to TRADERS' RESOURCE. | |
Click here for more information about our publications!
Comments

Request Information From Our Sponsors
- StockCharts.com, Inc.
- Candle Patterns
- Candlestick Charting Explained
- Intermarket Technical Analysis
- John Murphy on Chart Analysis
- John Murphy's Chart Pattern Recognition
- John Murphy's Market Message
- MurphyExplainsMarketAnalysis-Intermarket Analysis
- MurphyExplainsMarketAnalysis-Visual Analysis
- StockCharts.com
- Technical Analysis of the Financial Markets
- The Visual Investor
- VectorVest, Inc.
- Executive Premier Workshop
- One-Day Options Course
- OptionsPro
- Retirement Income Workshop
- Sure-Fire Trading Systems (VectorVest, Inc.)
- Trading as a Business Workshop
- VectorVest 7 EOD
- VectorVest 7 RealTime/IntraDay
- VectorVest AutoTester
- VectorVest Educational Services
- VectorVest OnLine
- VectorVest Options Analyzer
- VectorVest ProGraphics v6.0
- VectorVest ProTrader 7
- VectorVest RealTime Derby Tool
- VectorVest Simulator
- VectorVest Variator
- VectorVest Watchdog
