

HOT TOPICS LIST
- MACD
- Fibonacci
- RSI
- Gann
- ADXR
- Stochastics
- Volume
- Triangles
- Futures
- Cycles
- Volatility
- ZIGZAG
- MESA
- Retracement
- Aroon
INDICATORS LIST
LIST OF TOPICS
PRINT THIS ARTICLE
by Donald W. Pendergast, Jr.
Shares of New York Times 'A' stock (NTY)are up by 38% since making a major multicycle low on May 1, 2013 and are now sitting at an important support level; if this level holds off further selling, the odds are good for a tradable bullish swing move during the next few trading sessions. Here's a closer look.
Position: N/A
Donald W. Pendergast, Jr.
Freelance financial markets writer and online publisher of the Trendzetterz.com S&P 500 Weekly Forecast service.
PRINT THIS ARTICLE
RSI
NYT: Classic Pullback In A Bull Market?
07/24/13 03:03:26 PMby Donald W. Pendergast, Jr.
Shares of New York Times 'A' stock (NTY)are up by 38% since making a major multicycle low on May 1, 2013 and are now sitting at an important support level; if this level holds off further selling, the odds are good for a tradable bullish swing move during the next few trading sessions. Here's a closer look.
Position: N/A
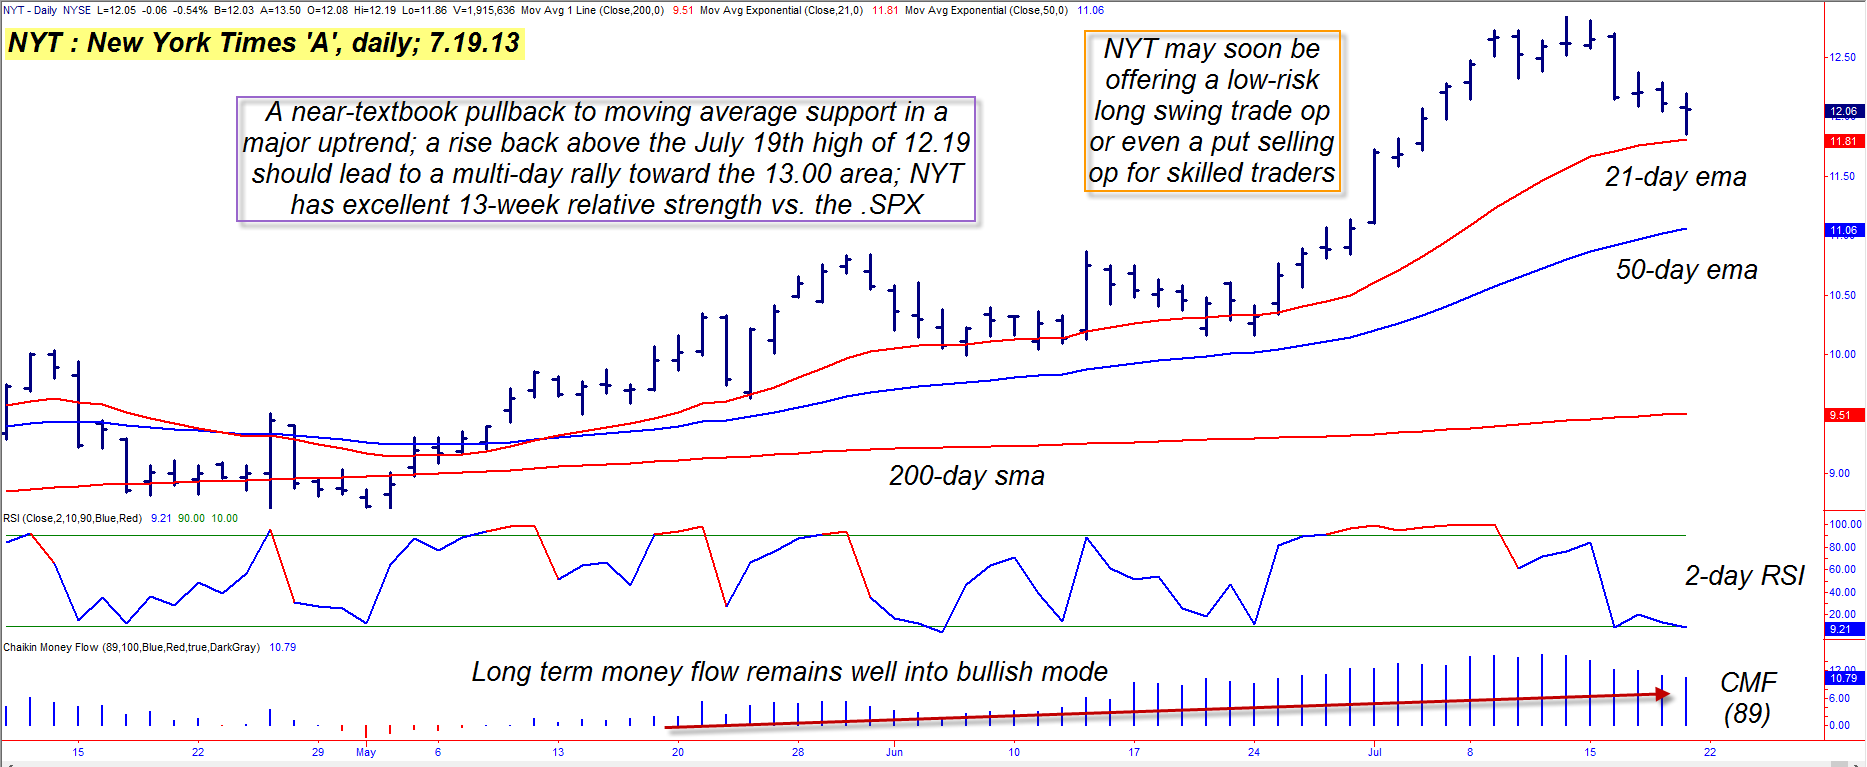
| While the major US stock indexes do seem to be in "distribution" phases – times where markets are gradually setting up for the transition from a bull market to a substantial correction – it always pays to recall that it's not just a "stock market" as much as it is a "market of stocks," and that some stocks and/or stock industry groups tend to keep on trending higher (although not at the same blistering pace) even as the broader markets lose upward momentum, stall, and then eventually reverse lower. New York Times 'A' shares might very well be one of these "buck the trend" issues, one that may very well be setting up for a decent swing move higher in the coming week of trading action. Here's the essential scenario for NYT, using its daily chart (Figure 1): 1. For stock swing traders, it is important to determine the general bullishness/bearishness of the long-term money flow trend; NYT's 89-day Chaikin money flow (CMF) histogram remains way above its zero line after the stock's recent pullback, which is very bullish indeed. 2. NYT is also trading above its 21- and 50-day exponential moving averages (EMA), with both EMA's still sloping upward. 3. NYT is also trading above its 200-day simple moving average (SMA). 4. NYT has exceptionally good comparative strength vs. the S&P 500 index (.SPX) over the past 13 weeks. 5. The two-period RSI is still down below a reading of 10.00. Overall, the general imagery here is one of a high relative strength, bullish money flow stock that is completing a proportional pullback against a major uptrend. All that is needed now to re-ignite the bullish flames is for NYT to rise back above the July 19, 2013 high of 12.19; if this happens in the next few sessions, expect the stock to quickly gather steam and make another attempt at the 13.00 level soon – probably by the end of July 2013. |
|
| Figure 1. NYT's daily chart presents a picture of a graceful, proportional pullback to key support in the midst of a powerful uptrend. |
| Graphic provided by: TradeStation. |
| |
| There are two simple ways to play a long swing move in NYT: 1. On a rise back above 12.19 – Sell the October '13 $11.00 put option, looking to bag gains if the option declines in value by 50 to 60% or if it increases in value by 80 to 90%. 2. Buy the shares outright, running a two to three bar trailing stop of the daily lows till final stop out. In either mode of trading, if NYT manages a fast move to the 12.80/12.90 area, consider taking at least half of your open gains, looking to trail the rest until stopped out or your option percentage gain/loss targets are hit. Risk no more than 1% on this trade (due to the "iffy" nature of the major stock indexes right now) and be prepared to work your short put entry price to get a better deal, as there is a .10 bid/ask spread in NYT's October '13 $100 put. Open interest is more than 100 contracts, however, so there is a reasonable amount of trading activity going on at this particular put strike. This looks like a good risk/reward swing trade setup, so be sure you monitor it for a potential long entry over the next few sessions. Trade wisely until we meet here again. |
|
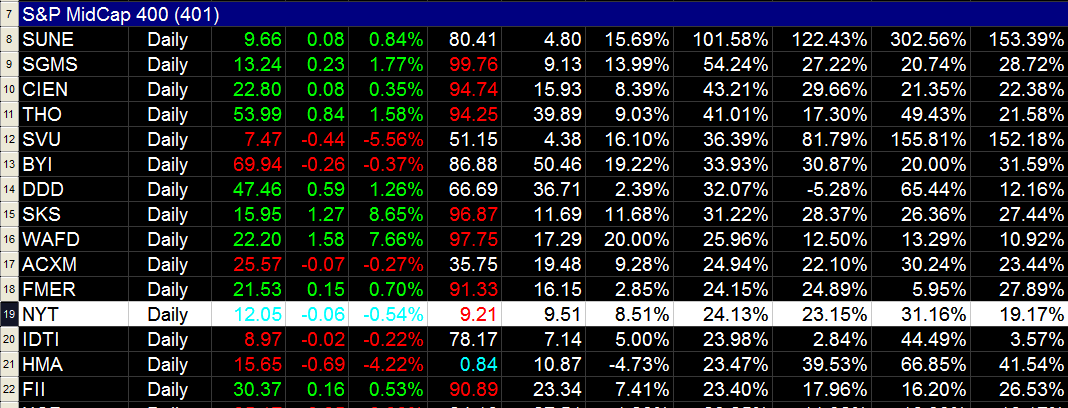
| Figure 2. NYT has also been outperforming many of its mid-cap peers – along with the .SPX – over the past 4-, 13- 26- and 52-week periods. |
| Graphic provided by: TradeStation. |
| Graphic provided by: TradeStation Radar Screen. |
| |
Freelance financial markets writer and online publisher of the Trendzetterz.com S&P 500 Weekly Forecast service.
| Title: | Market consultant and writer |
| Company: | Trendzetterz |
| Address: | 81 Hickory Hollow Drive |
| Crossville, TN 38555 | |
| Phone # for sales: | 904-303-4814 |
| Website: | trendzetterz.com |
| E-mail address: | support@trendzetterz.com |
Traders' Resource Links | |
| Trendzetterz has not added any product or service information to TRADERS' RESOURCE. | |
Click here for more information about our publications!
PRINT THIS ARTICLE

Request Information From Our Sponsors
- StockCharts.com, Inc.
- Candle Patterns
- Candlestick Charting Explained
- Intermarket Technical Analysis
- John Murphy on Chart Analysis
- John Murphy's Chart Pattern Recognition
- John Murphy's Market Message
- MurphyExplainsMarketAnalysis-Intermarket Analysis
- MurphyExplainsMarketAnalysis-Visual Analysis
- StockCharts.com
- Technical Analysis of the Financial Markets
- The Visual Investor
- VectorVest, Inc.
- Executive Premier Workshop
- One-Day Options Course
- OptionsPro
- Retirement Income Workshop
- Sure-Fire Trading Systems (VectorVest, Inc.)
- Trading as a Business Workshop
- VectorVest 7 EOD
- VectorVest 7 RealTime/IntraDay
- VectorVest AutoTester
- VectorVest Educational Services
- VectorVest OnLine
- VectorVest Options Analyzer
- VectorVest ProGraphics v6.0
- VectorVest ProTrader 7
- VectorVest RealTime Derby Tool
- VectorVest Simulator
- VectorVest Variator
- VectorVest Watchdog