HOT TOPICS LIST
- MACD
- Fibonacci
- RSI
- Gann
- ADXR
- Stochastics
- Volume
- Triangles
- Futures
- Cycles
- Volatility
- ZIGZAG
- MESA
- Retracement
- Aroon
INDICATORS LIST
LIST OF TOPICS
PRINT THIS ARTICLE
by Koos van der Merwe
To be a successful investor you must look for situations where the risk/reward ratio is greatly in your favor.
Position: Buy
Koos van der Merwe
Has been a technical analyst since 1969, and has worked as a futures and options trader with First Financial Futures in Johannesburg, South Africa.
PRINT THIS ARTICLE
ELLIOTT WAVE
Would You Buy Dell?
07/23/13 04:10:13 PMby Koos van der Merwe
To be a successful investor you must look for situations where the risk/reward ratio is greatly in your favor.
Position: Buy
| Today the market concensus is that the PC is dying – iPads and smartphones are killing it. But why are Micahel Dell and Carl Icahn fighting over a company that is going down the tubes? Could it be that the company has been acquiring assets in high-margin businesses that will allow the company to report turnaround earnings per share? Carl Icahn has an 8.7% stake in the company at an average cost of $13.58 per share. Michael Dell wanted to pay $13.65 per share. He is anxious to close the deal but Dell cancelled the July 18, 2013, vote as there appears to be insufficient votes to close the deal. He owns a big stake of Dell, and I am sure that he would take it private should he win the vote and to do so would sweeten his offer. What do the charts say? |

|
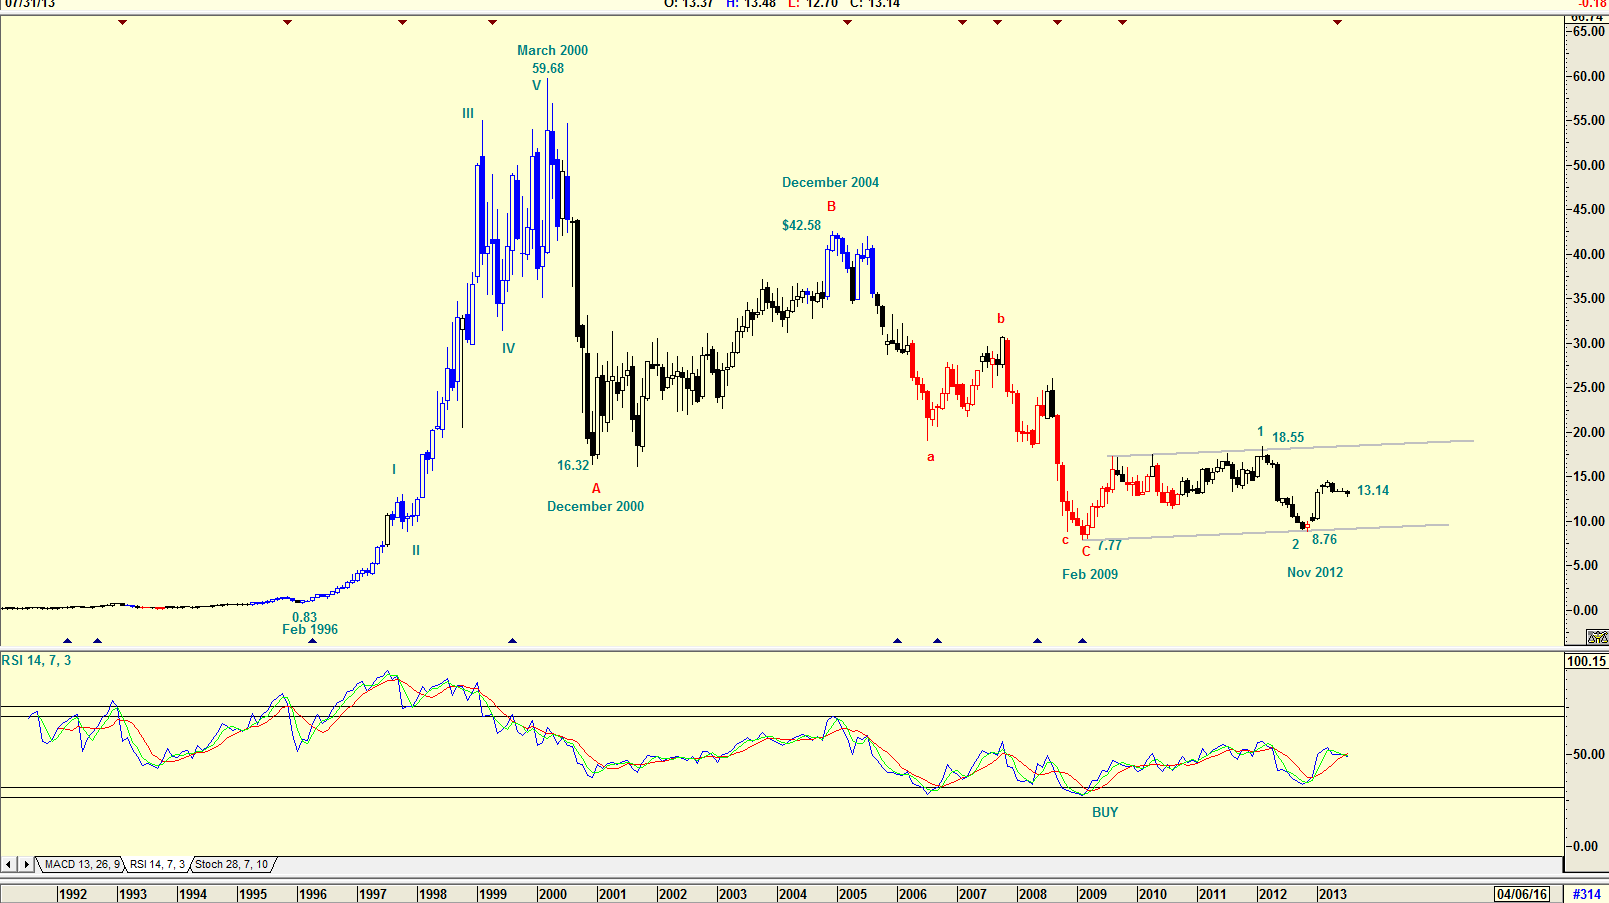
| Figure 1. Monthly chart of Dell. |
| Graphic provided by: AdvancedGET. |
| |
| The monthly chart in Figure 1 shows how the price moved from 83 cents in February 1996 to $59.68 by March 2000. Then when the technology bubble burst, the price dropped to $16.32 by December 2000. From this level it recovered to $42.58 by December 2004 and started collapsing from this level to $7.77 by February 2009. From that date, the share price has been moving sideways in a trading range between $18.55 and $8.76. The RSI indicator is showing the buy/sell signals. |

|
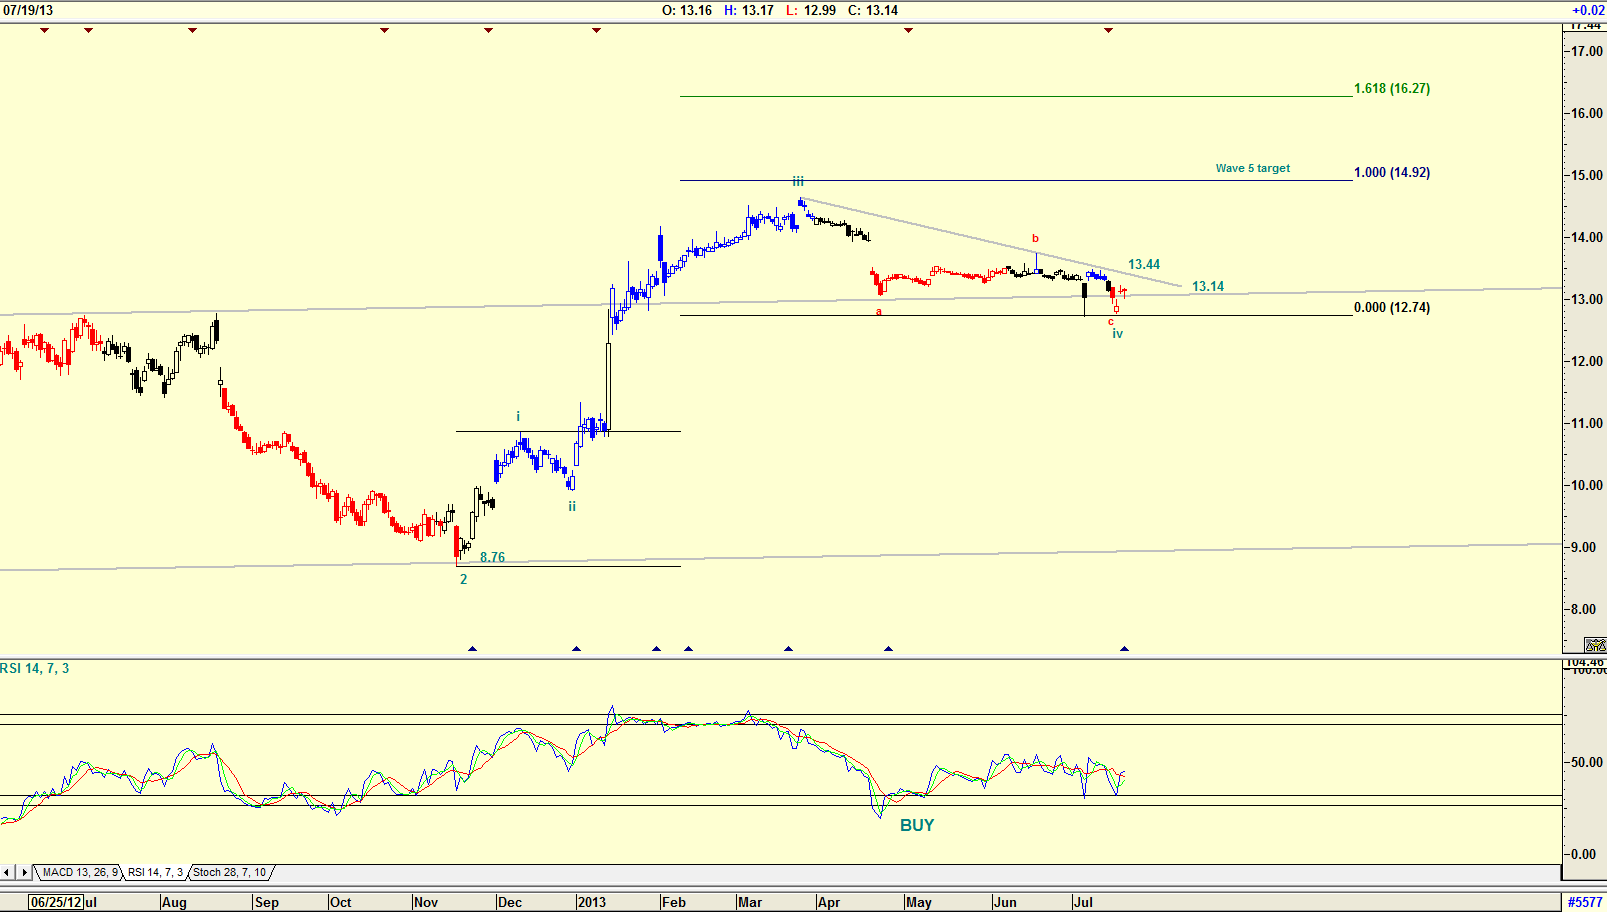
| Figure 2. Daily chart of Dell. |
| Graphic provided by: AdvancedGET. |
| |
| The daily chart in Figure 2 shows how the price moved between the long-term support and resistance lines. The chart is suggesting that should the price break above the resistance line at $13.44 it could rise to $14.92. This target is determined by the Elliott Wave count where a wave 5 should be equal to a wave 1. Whether the expected rise in price, as suggested by the chart, is caused by Michael Dell or Carl Icahn winning control of Dell is immaterial. Speculators could take the gamble, knowing that Elliott Wave theory with an RSI buy signal is suggesting a rise to $14.92, a 13.55% rise. |
Has been a technical analyst since 1969, and has worked as a futures and options trader with First Financial Futures in Johannesburg, South Africa.
| Address: | 3256 West 24th Ave |
| Vancouver, BC | |
| Phone # for sales: | 6042634214 |
| E-mail address: | petroosp@gmail.com |
Click here for more information about our publications!
Comments
Date: 07/24/13Rank: 5Comment:

Request Information From Our Sponsors
- VectorVest, Inc.
- Executive Premier Workshop
- One-Day Options Course
- OptionsPro
- Retirement Income Workshop
- Sure-Fire Trading Systems (VectorVest, Inc.)
- Trading as a Business Workshop
- VectorVest 7 EOD
- VectorVest 7 RealTime/IntraDay
- VectorVest AutoTester
- VectorVest Educational Services
- VectorVest OnLine
- VectorVest Options Analyzer
- VectorVest ProGraphics v6.0
- VectorVest ProTrader 7
- VectorVest RealTime Derby Tool
- VectorVest Simulator
- VectorVest Variator
- VectorVest Watchdog
- StockCharts.com, Inc.
- Candle Patterns
- Candlestick Charting Explained
- Intermarket Technical Analysis
- John Murphy on Chart Analysis
- John Murphy's Chart Pattern Recognition
- John Murphy's Market Message
- MurphyExplainsMarketAnalysis-Intermarket Analysis
- MurphyExplainsMarketAnalysis-Visual Analysis
- StockCharts.com
- Technical Analysis of the Financial Markets
- The Visual Investor
