HOT TOPICS LIST
- MACD
- Fibonacci
- RSI
- Gann
- ADXR
- Stochastics
- Volume
- Triangles
- Futures
- Cycles
- Volatility
- ZIGZAG
- MESA
- Retracement
- Aroon
INDICATORS LIST
LIST OF TOPICS
PRINT THIS ARTICLE
by Koos van der Merwe
Bernanke: Fed intends to maintain highly accommodative policy for the foreseeable future.
Position: Buy
Koos van der Merwe
Has been a technical analyst since 1969, and has worked as a futures and options trader with First Financial Futures in Johannesburg, South Africa.
PRINT THIS ARTICLE
ELLIOTT WAVE
We Want To Be In Financials
07/22/13 04:36:11 PMby Koos van der Merwe
Bernanke: Fed intends to maintain highly accommodative policy for the foreseeable future.
Position: Buy
| "Basel III is a floor, not a ceiling," said Ben Bernanke to a Senate committee meeting on July 18, 2013. Basel III is a voluntary regulatory standard on bank capital adequacy. It was supposed to strengthen bank capital requirements by increasing bank liquidity and decreasing bank leverage. The financial crisis of 2007-2010 led to widespread calls for changes in the regulatory system. In June 2009, President Obama introduced a proposal for a sweeping overhaul of the United States financial regulatory system, a transformation on a scale not seen since the reforms that followed the Great Depression. The question still out there is, "Are these banks that are too big to fail, going to be broken up?" The past week has seen very good results from Citigroup (C) and Bank of America (BAC). |

|
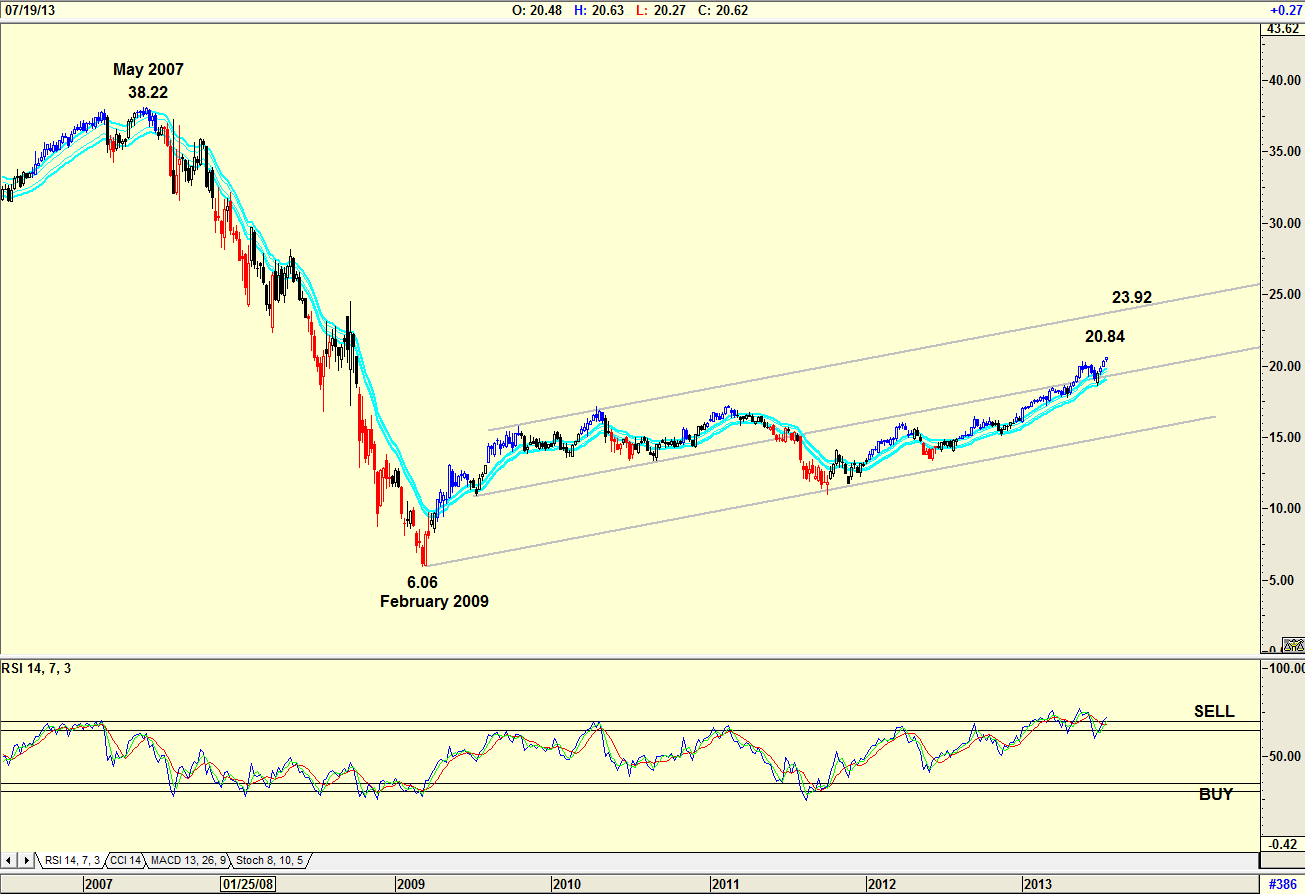
| Figure 1. Weekly Chart of Amex Financial Select Sector. |
| Graphic provided by: AdvancedGET. |
| |
| The weekly chart in Figure 1 of the Amex Financial Select Sector shows how the price dropped from a high of $38.22 in May 2007 to a low of $6.06 by February 2009, a drop of approximately 83%. The chart also shows how the price started recovering and is now trading at $20.84 with a possible resistance level at the upper trend line at $23.92. With the RSI index at oversold levels, suggesting a sell, it is doubtful whether this target will be reached, unless of course the index trades sideways while the RSI index moves to the buy level. This could well take a few months. With August and September – the quietest months of the year – coming up, this is a possibility. |

|
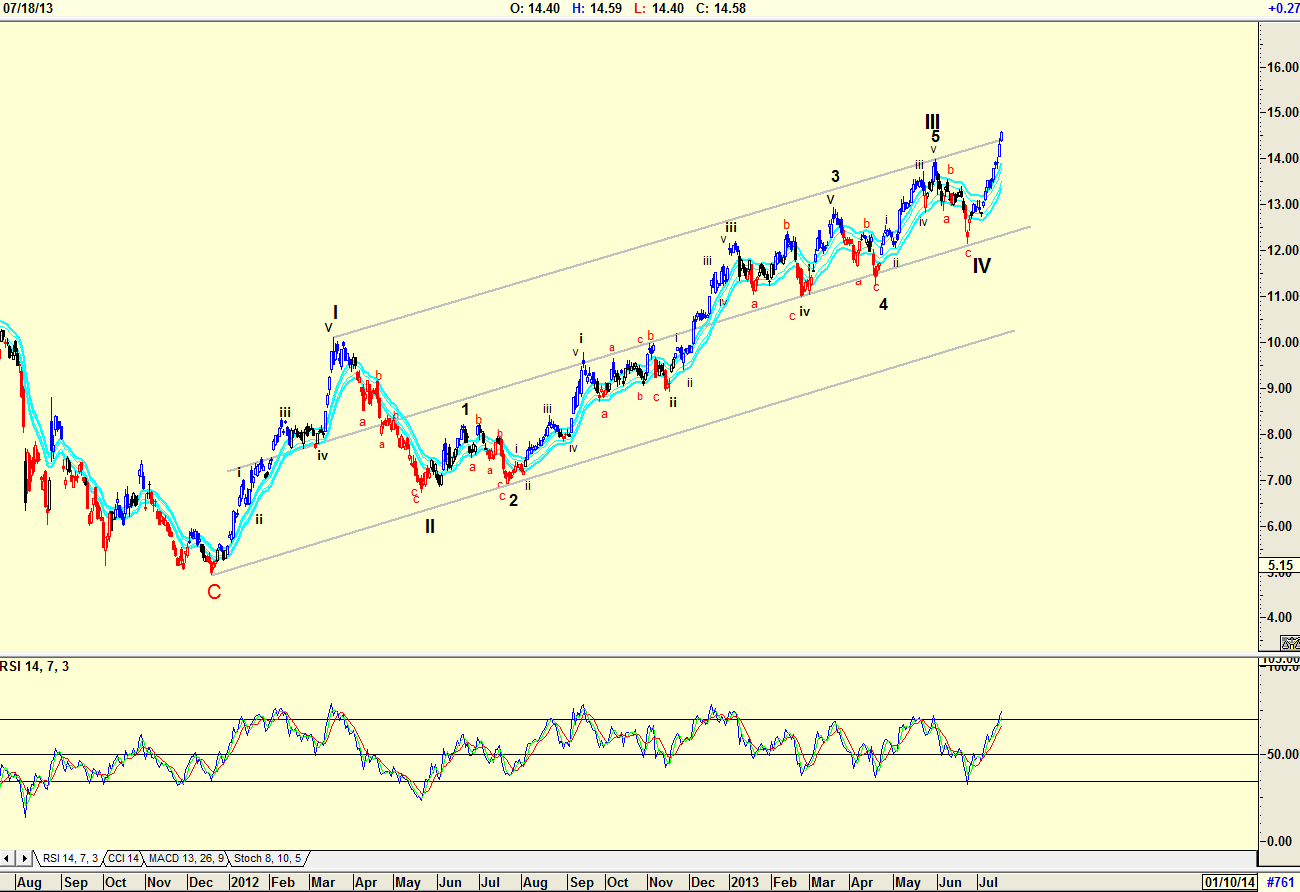
| Figure 2. Elliott Wave count of Bank of America. |
| Graphic provided by: AdvancedGET. |
| |
| The daily chart in Figure 2 of BAC displays my newest Elliott Wave count. Never forget that an Elliott Wave count is a signpost in the market wilderness, and there is always a new sign a little way down the road, suggesting a change in the count and a change in direction of the share price. When I look at the count I find that it does not follow the first rule of Elliott Waves, which is that the count must look correct. At the moment it does not look correct. The WAVE IV looks too simple. The Elliott rule states that if a WAVE II is a simple wave, then WAVE IV should be a complicated wave. WAVE II does look like a simple wave. The current count shows that WAVE IV is simpler but I would prefer to see it more complicated. The RSI indicator is at overbought levels, so a correction could occur in the near future, that is, during the August-September quiet months. |

|
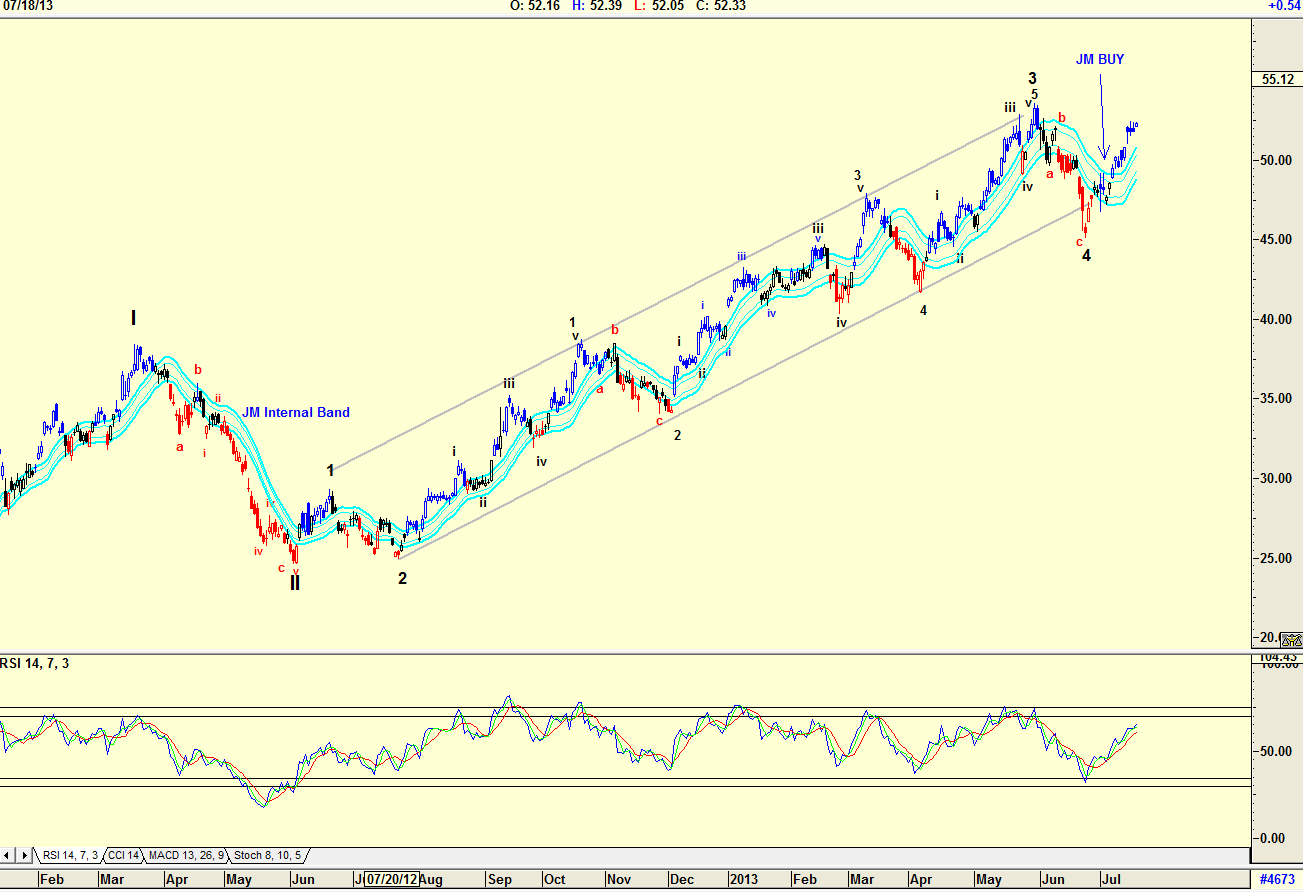
| Figure 3. Elliott Wave count of Citigroup. |
| Graphic provided by: AdvancedGET. |
| |
| The chart in Figure 3 is a daily chart of C with an Elliott Wave count that follows the first rule of Elliott Wave theory, and "looks correct". The Wave count also suggests that C is tracing a Wave 5 of a WAVE III. This is the pattern I would expect the chart of BAC to follow. Time will tell. Do note the buy signal given by the JM Internal Band. The JM Internal band is a 15-period simple moving average offset by 2% positive and 2% negative. A buy signal is triggered when the share price breaks above the upper band. |

|
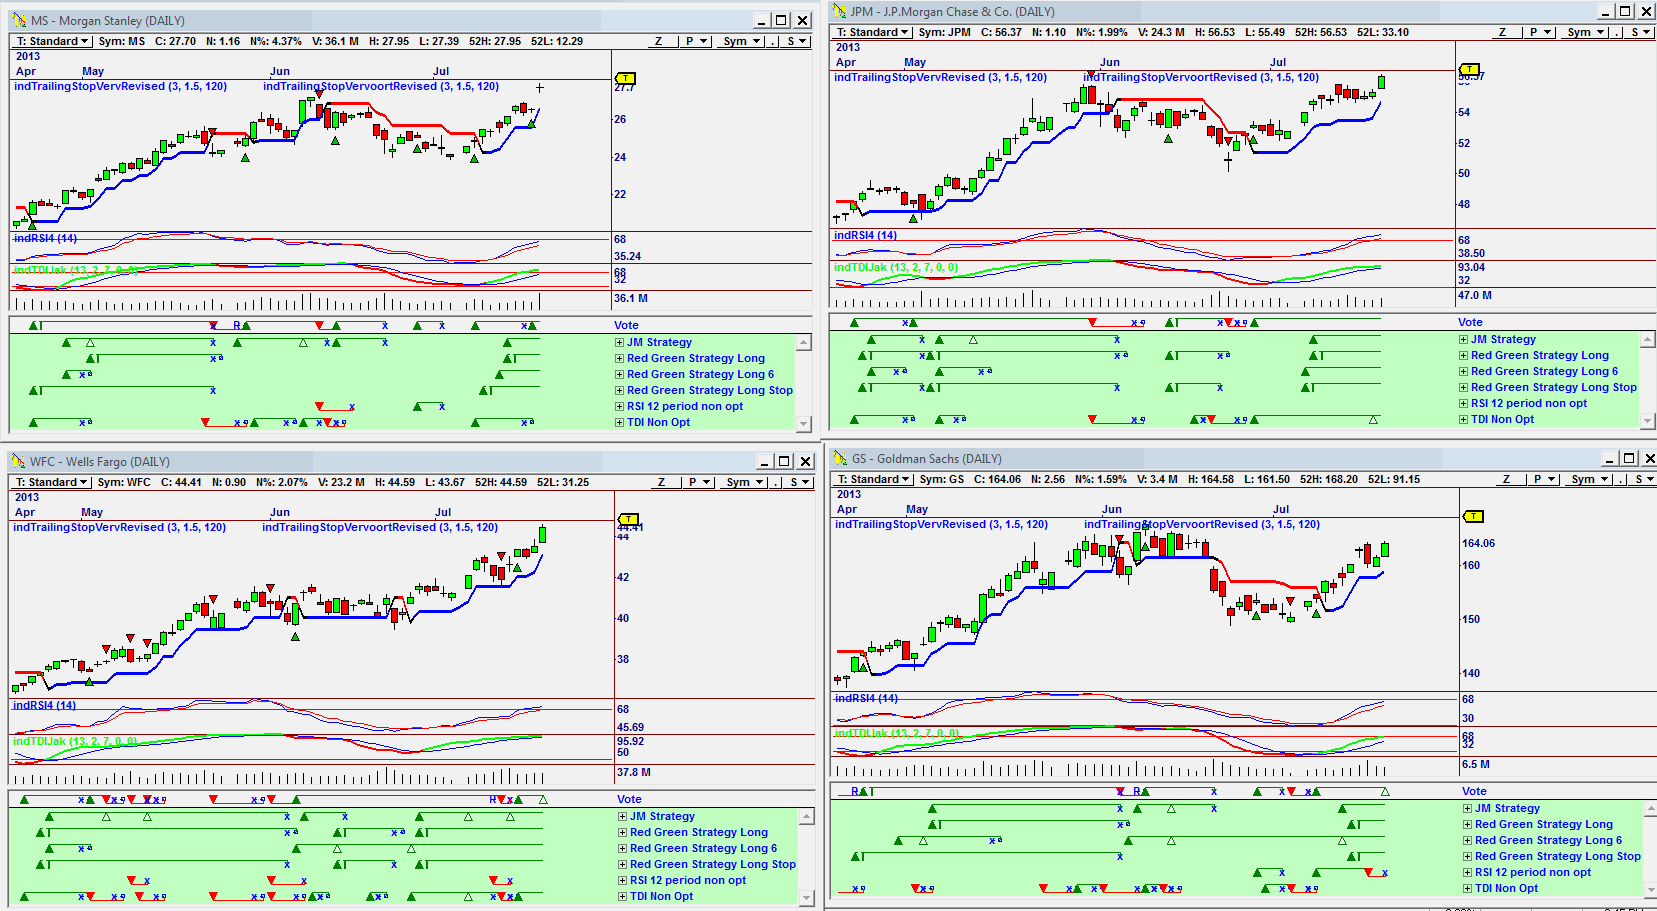
| Figure 4. Daily Charts of Morgan Stanley, JP Morgan Chase, Wells Fargo and Goldman Sachs all showing BUY signals. |
| Graphic provided by: Omnitrader. |
| |
| The chart in Figure 4 shows the BUY signals given by my Omnitrader strategies in Morgan Stanley, JP Morgan Chase, Wells Fargo, and Goldman Sachs. The signals are shown on the VOTE line and are a summation of the six strategies shown in green below the vote line. All are showing buy signals. I would be a buyer of any bank stock at present levels, but with the Elliott Wave and RSI indicators approaching overbought levels, I would keep my stops close. |
Has been a technical analyst since 1969, and has worked as a futures and options trader with First Financial Futures in Johannesburg, South Africa.
| Address: | 3256 West 24th Ave |
| Vancouver, BC | |
| Phone # for sales: | 6042634214 |
| E-mail address: | petroosp@gmail.com |
Click here for more information about our publications!
PRINT THIS ARTICLE

Request Information From Our Sponsors
- StockCharts.com, Inc.
- Candle Patterns
- Candlestick Charting Explained
- Intermarket Technical Analysis
- John Murphy on Chart Analysis
- John Murphy's Chart Pattern Recognition
- John Murphy's Market Message
- MurphyExplainsMarketAnalysis-Intermarket Analysis
- MurphyExplainsMarketAnalysis-Visual Analysis
- StockCharts.com
- Technical Analysis of the Financial Markets
- The Visual Investor
- VectorVest, Inc.
- Executive Premier Workshop
- One-Day Options Course
- OptionsPro
- Retirement Income Workshop
- Sure-Fire Trading Systems (VectorVest, Inc.)
- Trading as a Business Workshop
- VectorVest 7 EOD
- VectorVest 7 RealTime/IntraDay
- VectorVest AutoTester
- VectorVest Educational Services
- VectorVest OnLine
- VectorVest Options Analyzer
- VectorVest ProGraphics v6.0
- VectorVest ProTrader 7
- VectorVest RealTime Derby Tool
- VectorVest Simulator
- VectorVest Variator
- VectorVest Watchdog
