

HOT TOPICS LIST
- MACD
- Fibonacci
- RSI
- Gann
- ADXR
- Stochastics
- Volume
- Triangles
- Futures
- Cycles
- Volatility
- ZIGZAG
- MESA
- Retracement
- Aroon
INDICATORS LIST
LIST OF TOPICS
PRINT THIS ARTICLE
by Donald W. Pendergast, Jr.
What is a stock running higher on if it has bearish money flow, is under heavy distribution, and also belongs to a fundamentally weak industry group?
Position: N/A
Donald W. Pendergast, Jr.
Freelance financial markets writer and online publisher of the Trendzetterz.com S&P 500 Weekly Forecast service.
PRINT THIS ARTICLE
RSI
PFG: Running On Fumes?
07/22/13 04:30:37 PMby Donald W. Pendergast, Jr.
What is a stock running higher on if it has bearish money flow, is under heavy distribution, and also belongs to a fundamentally weak industry group?
Position: N/A
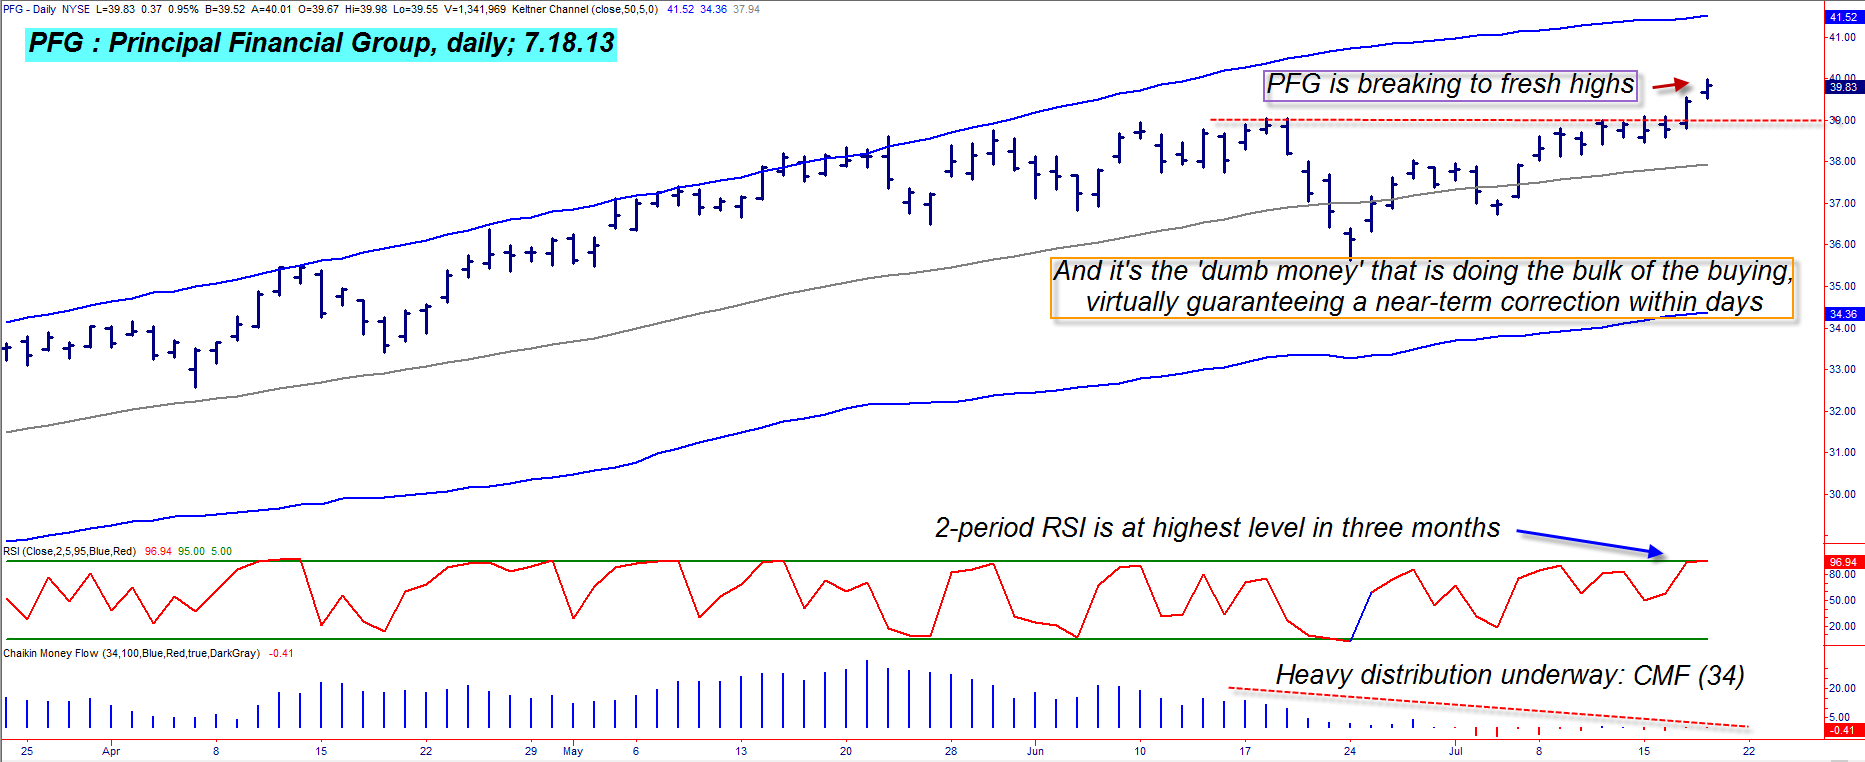
| The answer, at least in the case of Principal Financial Group, Inc. (PFG) appears to be this – "On borrowed time." This becomes very easy to comprehend as we glance at this financial sector stock's daily chart in Figure 1, where we find the following dynamics at work: 1. PFG recently broke above a key resistance level (red dashed line) and is now at a 57-month high. 2. Its 34-day Chaikin Money flow histogram (CMF)(34), incredibly, has actually dropped back beneath its zero line (bearish) and the chart confirms that the so-called "smart money" has been busy scaling out of their long positions in this stock since late May 2013. 3. The two-day RSI indicator is now sitting at a three-month high; in a strong uptrend this indicator is less reliable as an "overbought" confirmation, but in the case of PFG, its 10-day ADX (Average Directional Movement index) confirms that the stock is not in a particularly strong uptrend (its current reading is 23.42). All together, these three technical dynamics paint a vivid picture of a stock that is grinding higher with nothing but proverbial "fumes" in its money flow "gas tank" to keep its bullish flame alight. As soon as the broad market follows through on its transition from a bullish to bearish trend (already underway, apparently), PFG should be hit with a flood of short selling orders, taking its price back down to test the Keltner midline (near 37.94) very rapidly indeed. The fundamentals (earnings growth, etc.) for PFG's industry group peers are well below the broad market average and that should also bring the bears out in force, looking to gorge themselves on bloated, over valued financials such as PFG. |
|
| Figure 1. While PFG may be trading at a new 57-month high, astute traders will take note of the wildly bearish money flow histogram on the stock's daily chart. The "smart money" has been steadily bailing out of this stock since May 2013. |
| Graphic provided by: TradeStation. |
| |
| Anyone currently holding a long position in PFG needs to consider taking steps to either protect open profits (buying puts) or to start liquidating their positions altogether; the risks of continuing to hold on for more near-term gains far outweighs the potential for more upside at this particular juncture. Speculative bears might also want to consider shorting PFG should it drop below 39.55, running some sort of a volatility trailing stop to help retain open profits and/or limit losses should a short entry be triggered soon. Conservative traders might want to book partial profits should the stock drop and hit the Keltner midline in rapid fashion, by the way. Buying long puts is also an "option" (pardon the pun), but the bid/ask spreads on PFG puts and calls are just too wide, negating much of their potential edge; in this case, shorting looks like a better strategy than buying puts. Whichever strategy you decide on, be sure to keep your account risk for the trade at somewhere between 1 and 2%, no matter how convincing this technical assessment of PFG may be to you. Trade wisely until we meet here again. |
|
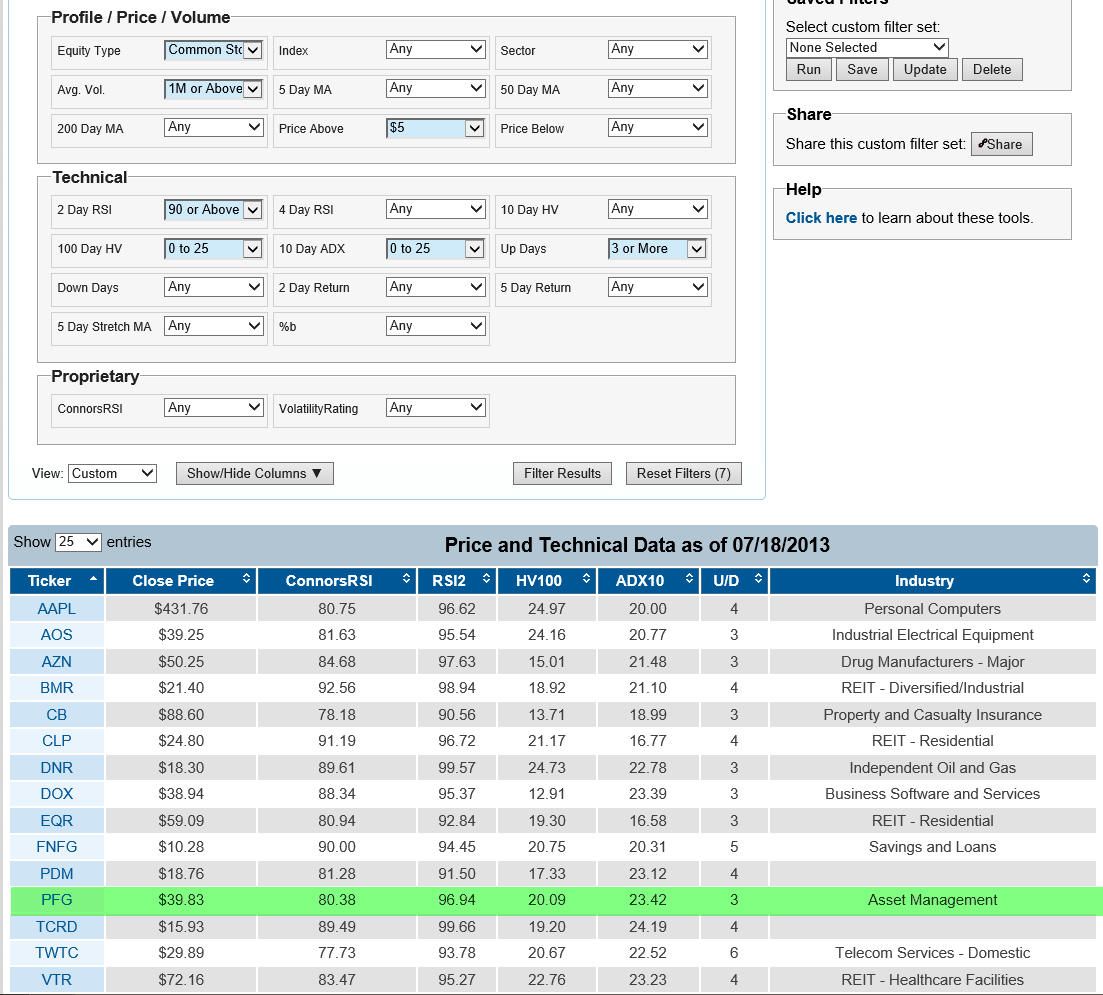
| Figure 2. These 15 liquid stocks (average 50-day trading volume of 1 million shares per day or greater) all have 2-day RSI readings that are above 90.00. Note that three different REIT's made the list, perhaps confirming an upcoming correction for that industry group. |
| Graphic provided by: Trading Markets Live Screener. |
| |
Freelance financial markets writer and online publisher of the Trendzetterz.com S&P 500 Weekly Forecast service.
| Title: | Market consultant and writer |
| Company: | Trendzetterz |
| Address: | 81 Hickory Hollow Drive |
| Crossville, TN 38555 | |
| Phone # for sales: | 904-303-4814 |
| Website: | trendzetterz.com |
| E-mail address: | support@trendzetterz.com |
Traders' Resource Links | |
| Trendzetterz has not added any product or service information to TRADERS' RESOURCE. | |
Click here for more information about our publications!
PRINT THIS ARTICLE

Request Information From Our Sponsors
- StockCharts.com, Inc.
- Candle Patterns
- Candlestick Charting Explained
- Intermarket Technical Analysis
- John Murphy on Chart Analysis
- John Murphy's Chart Pattern Recognition
- John Murphy's Market Message
- MurphyExplainsMarketAnalysis-Intermarket Analysis
- MurphyExplainsMarketAnalysis-Visual Analysis
- StockCharts.com
- Technical Analysis of the Financial Markets
- The Visual Investor
- VectorVest, Inc.
- Executive Premier Workshop
- One-Day Options Course
- OptionsPro
- Retirement Income Workshop
- Sure-Fire Trading Systems (VectorVest, Inc.)
- Trading as a Business Workshop
- VectorVest 7 EOD
- VectorVest 7 RealTime/IntraDay
- VectorVest AutoTester
- VectorVest Educational Services
- VectorVest OnLine
- VectorVest Options Analyzer
- VectorVest ProGraphics v6.0
- VectorVest ProTrader 7
- VectorVest RealTime Derby Tool
- VectorVest Simulator
- VectorVest Variator
- VectorVest Watchdog