

HOT TOPICS LIST
- MACD
- Fibonacci
- RSI
- Gann
- ADXR
- Stochastics
- Volume
- Triangles
- Futures
- Cycles
- Volatility
- ZIGZAG
- MESA
- Retracement
- Aroon
INDICATORS LIST
LIST OF TOPICS
PRINT THIS ARTICLE
by Chaitali Mohile
The long-term downtrend of AGII has reversed.
Position: Buy
Chaitali Mohile
Active trader in the Indian stock markets since 2003 and a full-time writer. Trading is largely based upon technical analysis.
PRINT THIS ARTICLE
BREAKOUTS
AGII Poised For A Bull Run?
07/19/13 04:20:05 PMby Chaitali Mohile
The long-term downtrend of AGII has reversed.
Position: Buy
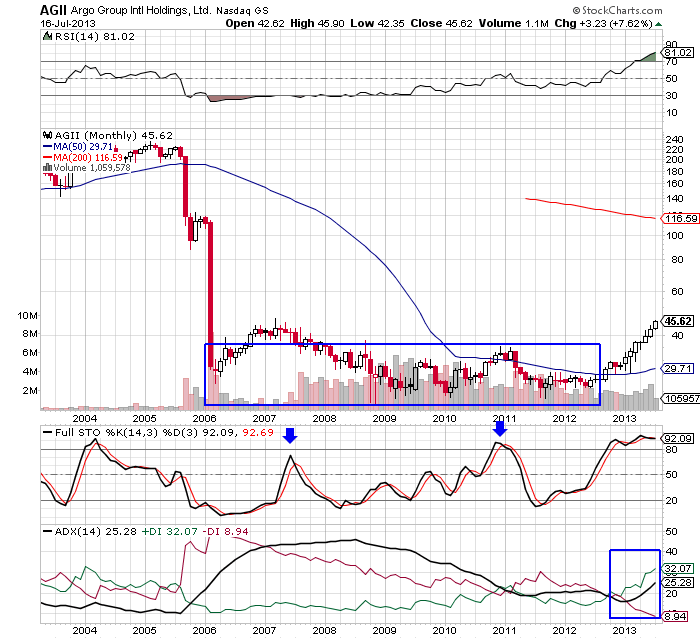
| Agro Group Intl Holding (AGII) was at its all time high in 2005. But it went through a significant correction after that. You could have been alerted to this weakening if you had taken note of the negative divergence between price and the relative strength index (RSI)(14). In a very short time span, AGII crashed down to $29.71 and established support in this lower region. Thereafter, the stock moved horizontally in a trading range from 25 to 40. This lower consolidation phase continued for about six years. |
| While in this wide trading range, the average directional index (ADX)(14) (Figure 1) surged above 20 levels. The full stochastic oscillator (14,3,3) failed to sustain in the bullish region above 50 levels. It slipped twice from the overbought area. This shows that the stock was under strong bearish influence for the past six years. |
|
| FIGURE 1: AGII, MONTHLY. |
| Graphic provided by: StockCharts.com. |
| |
| The longer the consolidation, the stronger the trend will be once price breaks out of the consolidation. Note the small white candles surging with the 50-day moving average (MA) support in Figure 1. The size of the candlesticks reflect the developing bullish confidence in the new rally. The bullish breakout gave birth to a fresh uptrend and also pulled the stochastic oscillator into an overbought zone. The RSI(14) is showing robust bullish strength. Currently, AGII has marked its 52-week high. Since the big picture in Figure 1 is healthily bullish the stock is likely to continue its journey above the 45 levels. |
|
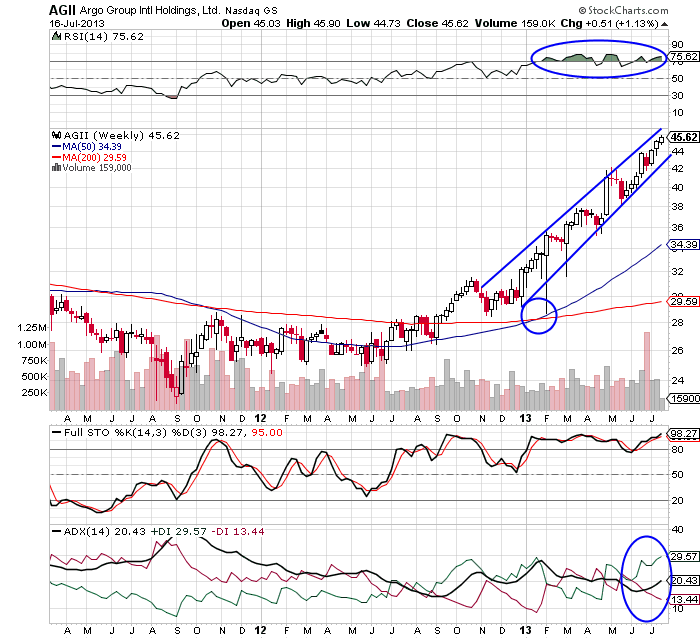
| FIGURE 2: AGII, WEEKLY. |
| Graphic provided by: StockCharts.com. |
| |
| The weekly chart in Figure 2 shows the exact breakout levels and the medium-term trading conditions of AGII. The stock breached the 50-day and the 200-day MA resistance in late 2012. The bullish moving average breakout induced strong bullish force in the rally. Both the moving averages followed the price rally, and eventually, underwent a bullish crossover on the price chart as seen in Figure 2. After the crossover, the buying pressure increased and developed an uptrend. An overbought stochastic oscillator and the RSI(14) are steadily moving in their respective bullish zone. Hence, there is no threat to the current bullish rally. |
| AGII can be considered by short-term and long-term traders and investors. Since the bullish breakout has occurred recently, the stock should travel with enormous bullish strength. Thus, traders can grab the opportunity to trade this stock. |
Active trader in the Indian stock markets since 2003 and a full-time writer. Trading is largely based upon technical analysis.
| Company: | Independent |
| Address: | C1/3 Parth Indraprasth Towers. Vastrapur |
| Ahmedabad, Guj 380015 | |
| E-mail address: | chaitalimohile@yahoo.co.in |
Traders' Resource Links | |
| Independent has not added any product or service information to TRADERS' RESOURCE. | |
Click here for more information about our publications!
PRINT THIS ARTICLE

Request Information From Our Sponsors
- VectorVest, Inc.
- Executive Premier Workshop
- One-Day Options Course
- OptionsPro
- Retirement Income Workshop
- Sure-Fire Trading Systems (VectorVest, Inc.)
- Trading as a Business Workshop
- VectorVest 7 EOD
- VectorVest 7 RealTime/IntraDay
- VectorVest AutoTester
- VectorVest Educational Services
- VectorVest OnLine
- VectorVest Options Analyzer
- VectorVest ProGraphics v6.0
- VectorVest ProTrader 7
- VectorVest RealTime Derby Tool
- VectorVest Simulator
- VectorVest Variator
- VectorVest Watchdog
- StockCharts.com, Inc.
- Candle Patterns
- Candlestick Charting Explained
- Intermarket Technical Analysis
- John Murphy on Chart Analysis
- John Murphy's Chart Pattern Recognition
- John Murphy's Market Message
- MurphyExplainsMarketAnalysis-Intermarket Analysis
- MurphyExplainsMarketAnalysis-Visual Analysis
- StockCharts.com
- Technical Analysis of the Financial Markets
- The Visual Investor