

HOT TOPICS LIST
- MACD
- Fibonacci
- RSI
- Gann
- ADXR
- Stochastics
- Volume
- Triangles
- Futures
- Cycles
- Volatility
- ZIGZAG
- MESA
- Retracement
- Aroon
INDICATORS LIST
LIST OF TOPICS
PRINT THIS ARTICLE
by Donald W. Pendergast, Jr.
Shares of Abbott Laboratories, Inc. have met up with strong resistance after a two-week rally.
Position: N/A
Donald W. Pendergast, Jr.
Freelance financial markets writer and online publisher of the Trendzetterz.com S&P 500 Weekly Forecast service.
PRINT THIS ARTICLE
RSI
Abbott Labs : Potential Short Setup
07/18/13 05:14:47 PMby Donald W. Pendergast, Jr.
Shares of Abbott Laboratories, Inc. have met up with strong resistance after a two-week rally.
Position: N/A
| With the entire US stock market likely to turn lower over the next few weeks, now is a great time to start sizing up potential shorting and/or long put option trading candidates. Here's a look at a large cap big pharma issue that looks like it might fit the bill for those looking for a low risk, short-term bearish stock trade. |
|
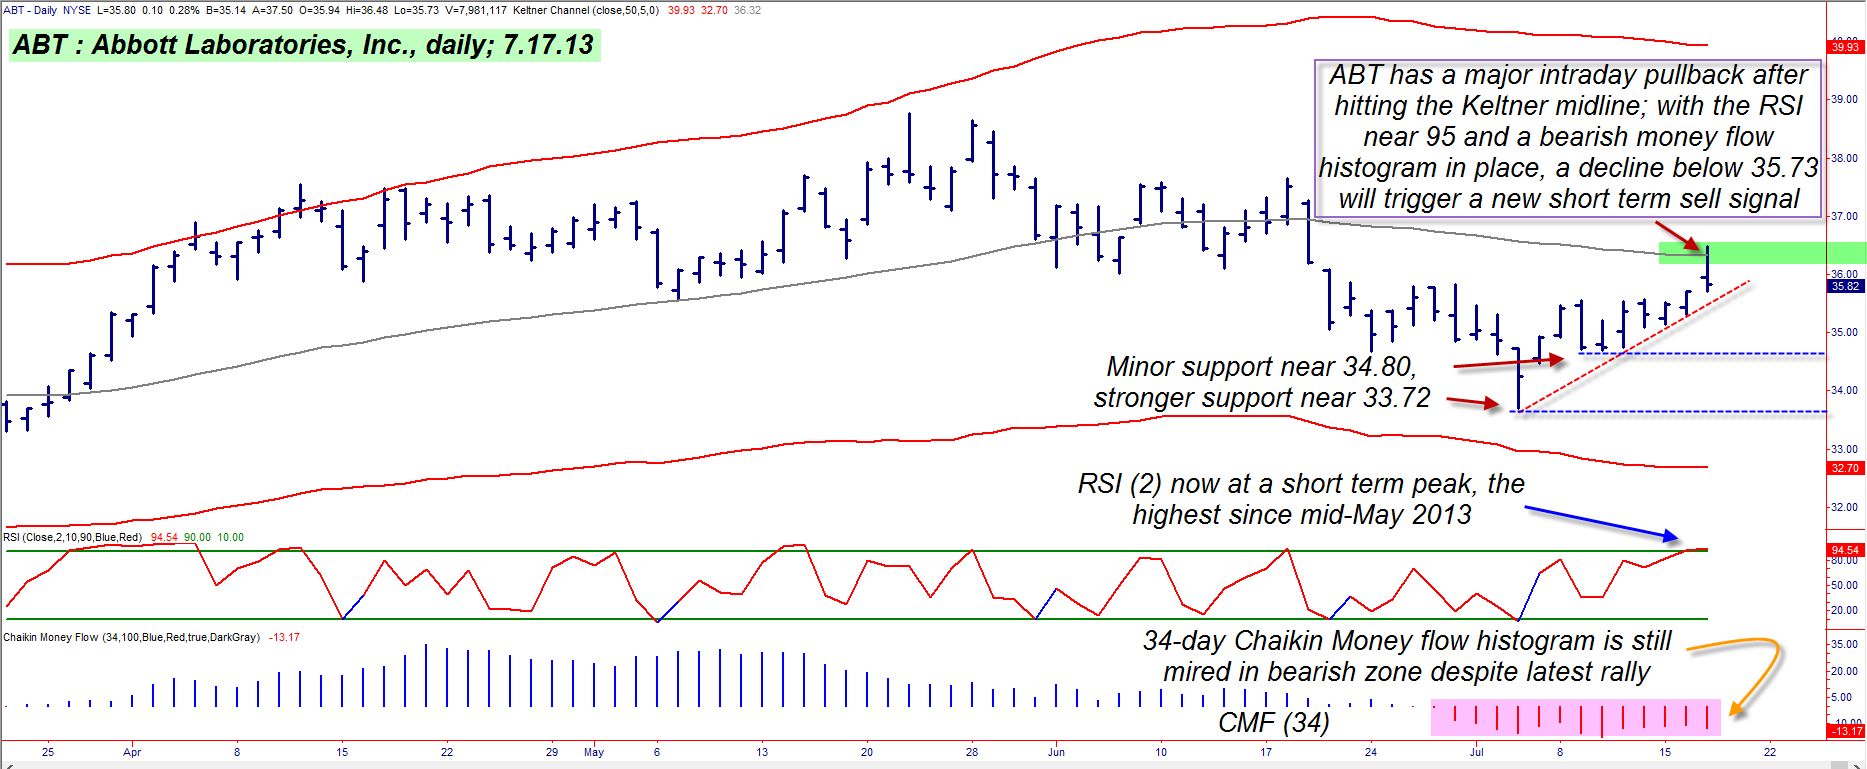
| Figure 1. A weak 13-week relative strength stock in a weak industry group can be a good shorting candidate; here, an overbought RSI, key resistance level and bearish money flow all work together to halt ABT's latest two-week rally. |
| Graphic provided by: TradeStation. |
| |
| The long-running bull run coming out of the major multicycle lows of November 2012 seems to be getting a bit indecisive as of late, and with many S&P 500 component stocks now manifesting significant signs of distribution (smart money selling out to latecomers hoping for even more gains to materialize soon), now is not the time to be an aggressive buyer of stocks or covered call plays. Actually, for most conservative traders and investors, it's a great time to go to cash and to wait things out until the next great buying opportunity in US stocks appears – probably later this summer. But for aggressive traders who can handle the rigors of short selling or the less stressful practice of buying put options on weak stocks, the next few weeks could be a real profit opportunity bonanza. Ebay (EBAY) just had a significant earnings miss and things are looking a bit iffy for Caterpillar's (CAT) earnings growth rates as well; it will be interesting to see if other big caps also begin to report lackluster Q2 earnings or declining revenues and margins. In the case of ABT, the company has beat earnings expectations in 10 of its last 12 reporting periods, so the overall trend in this key metric is doing okay. However, the big pharma stock industry group has been a relatively poor performer compared to the S&P 500 index (.SPX) over the past 13 weeks (one calendar quarter), and with ABT now hitting major resistance after enjoying a modest two-week long rally, this looks like a good, low-risk short setup. |
|
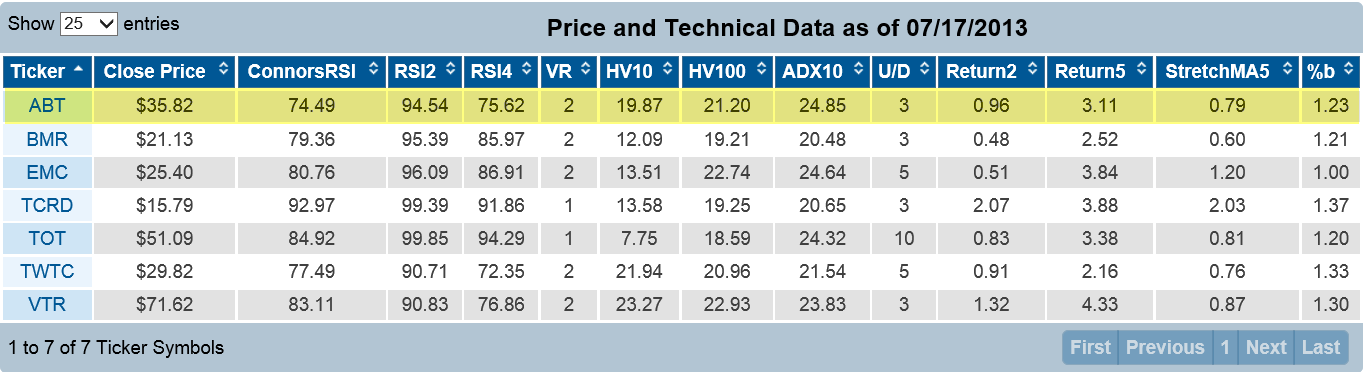
| Figure 2. A number of diverse, liquid stocks are flashing overbought 2-period RSI readings as of the close on Wednesday July 17, 2013. |
| Graphic provided by: Trading Markets Live Screener. |
| |
| Looking at ABT's daily chart in Figure 1, we find that its two-day RSI indicator is at its highest reading in more than two months, even as the stock has pulled back intraday after hitting its Keltner midline (green box). All this is happening as money flow is still mired in bearish (red zone) territory, and, taken as a whole, the scene suggests that there simply are no serious buyers willing to try and push ABT much higher at this particular time; in fact, it looks like a great time to sell ABT if currently long out of the early July 2013 hole and to also consider going short, as follows: 1. If ABT drops back below Wednesday's low of 35.73, short the shares, setting an initial stop loss just above 36.55. 2. Since the very weak money flow trend suggests that ABT may be in the early stages of a larger down-trending move, traders might want to give the trade some room to run, perhaps using a 10-day ATR volatility trailing stop with a multiplier of 1.75 or 2.00. Traders desiring a shorter-term holding period might just look to hold for two to three bars after entry, or maybe even look to take profits if the RSI begins to get back down toward the 20.00 or 30.00 level. 3. Since you would be selling on weakness, you would have some downward momentum already in your favor, meaning that you might want to risk up to 2% of your account value on this trade. Open interest and daily trading volume in the August/November 2013 ABT puts is excellent, with good bid/ask spreads, too; traders may wish to buy puts instead of having to short stock, and either of those option months should be up to the job for this short-term potential trade in ABT. As always, trade wisely until we meet here again. |
Freelance financial markets writer and online publisher of the Trendzetterz.com S&P 500 Weekly Forecast service.
| Title: | Market consultant and writer |
| Company: | Trendzetterz |
| Address: | 81 Hickory Hollow Drive |
| Crossville, TN 38555 | |
| Phone # for sales: | 904-303-4814 |
| Website: | trendzetterz.com |
| E-mail address: | support@trendzetterz.com |
Traders' Resource Links | |
| Trendzetterz has not added any product or service information to TRADERS' RESOURCE. | |
Click here for more information about our publications!
PRINT THIS ARTICLE

Request Information From Our Sponsors
- StockCharts.com, Inc.
- Candle Patterns
- Candlestick Charting Explained
- Intermarket Technical Analysis
- John Murphy on Chart Analysis
- John Murphy's Chart Pattern Recognition
- John Murphy's Market Message
- MurphyExplainsMarketAnalysis-Intermarket Analysis
- MurphyExplainsMarketAnalysis-Visual Analysis
- StockCharts.com
- Technical Analysis of the Financial Markets
- The Visual Investor
- VectorVest, Inc.
- Executive Premier Workshop
- One-Day Options Course
- OptionsPro
- Retirement Income Workshop
- Sure-Fire Trading Systems (VectorVest, Inc.)
- Trading as a Business Workshop
- VectorVest 7 EOD
- VectorVest 7 RealTime/IntraDay
- VectorVest AutoTester
- VectorVest Educational Services
- VectorVest OnLine
- VectorVest Options Analyzer
- VectorVest ProGraphics v6.0
- VectorVest ProTrader 7
- VectorVest RealTime Derby Tool
- VectorVest Simulator
- VectorVest Variator
- VectorVest Watchdog