

HOT TOPICS LIST
- MACD
- Fibonacci
- RSI
- Gann
- ADXR
- Stochastics
- Volume
- Triangles
- Futures
- Cycles
- Volatility
- ZIGZAG
- MESA
- Retracement
- Aroon
INDICATORS LIST
LIST OF TOPICS
PRINT THIS ARTICLE
by Donald W. Pendergast, Jr.
Buying/selling pullbacks near short-term oversold/overbought extremes can still be a viable trading strategy.
Position: N/A
Donald W. Pendergast, Jr.
Freelance financial markets writer and online publisher of the Trendzetterz.com S&P 500 Weekly Forecast service.
PRINT THIS ARTICLE
RSI
CarMax: A Buy After A Mini-Decline?
07/17/13 05:12:52 PMby Donald W. Pendergast, Jr.
Buying/selling pullbacks near short-term oversold/overbought extremes can still be a viable trading strategy.
Position: N/A
| If you've been trading for any length of time, you've probably been exposed to a variety of interesting trading concepts; one of the more reliable short-term strategies is based on trading pullbacks to meaningful support/resistance and/or overbought/oversold zones, and such methodologies can be effective at nailing minor two- to four-bar swing moves a high percentage of the time, provided you do a little selective filtering. Here are a few ideas that might help improve your swing trading win percentages. |
|
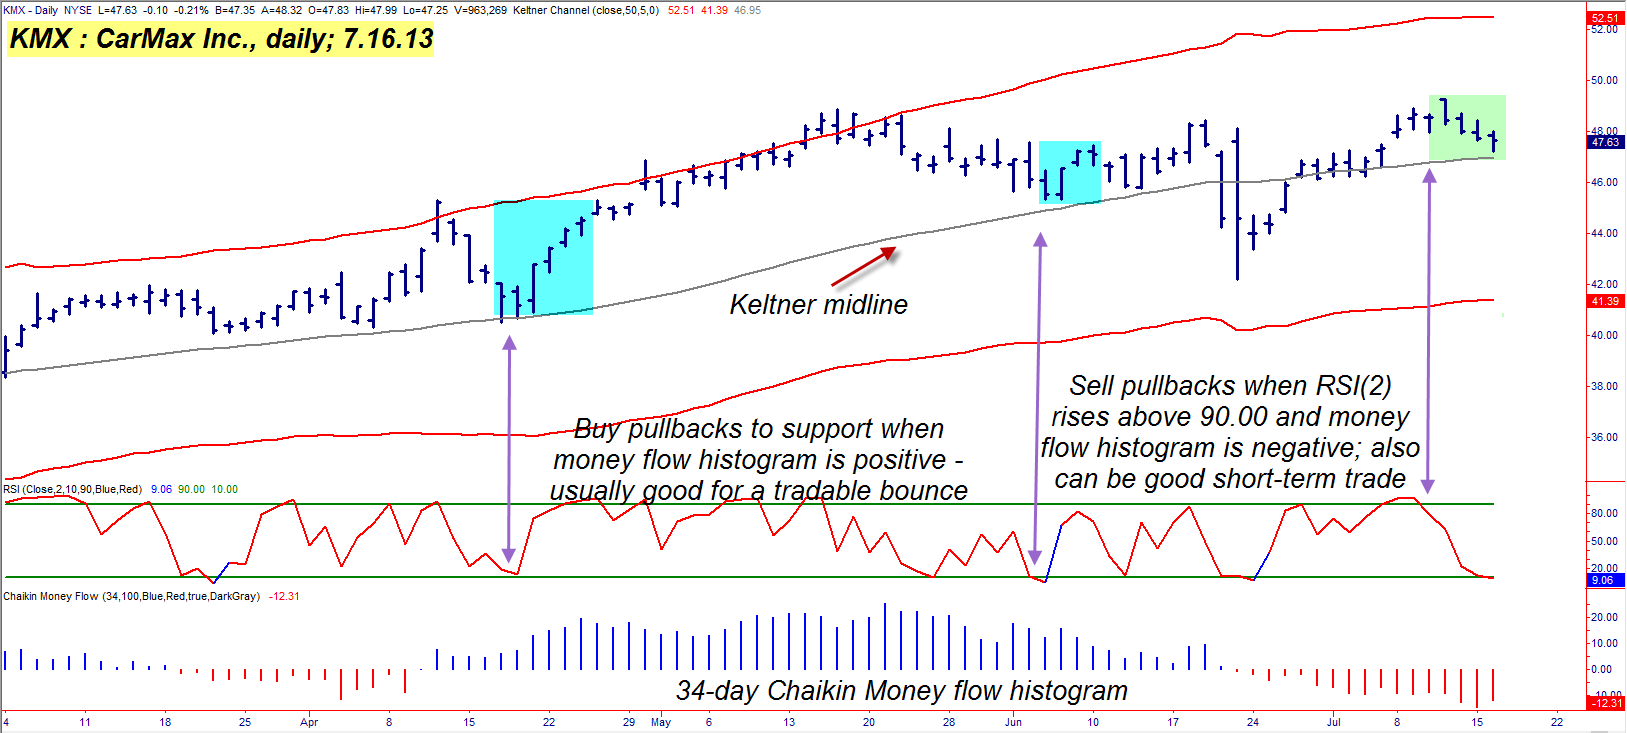
| Figure 1. While it is true that CarMax's (KMX) 2-period RSI is 'oversold', note that its money flow histogram is in the red (bearish) zone. Long pullback trades generally work better when the money flow histogram is above its zero line. |
| Graphic provided by: TradeStation. |
| |
| On the daily chart of CarMax, Inc. (KMX) in Figure 1 is a Keltner band (set at five ATRs away from a 50-period simple moving average), a two-period RSI indicator (with overbought/oversold levels of 90 and 10, respectively) and a 34-period Chaikin Money flow histogram (CMF)(34). There's no high-level math or deep technical concepts to learn here, so here are the basics: 1. When the money flow histogram is above its zero line (blue zone), look for occasions where a stock or ETF pulls back close to the Keltner band midline or other meaningful support zone like a strong Fibonacci confluence or a major uptrend line. 2. Wait for the reversal to actually occur and then enter on a break above the reversal bar high, looking to hold for another one to three bars. 3. If the two-period RSI indicator has also pulled back down below 10.00 at the same time such key support levels are hit, you'll have an even better setup for a potential long entry. 4. For short trades, simply invert all of the above, looking for the money flow histogram to be negative (red zone) at the same time price pulls back toward key resistance levels even as the two-period RSI rises above 90.00. Wait for the turn lower and then go short on a break below the low of the reversal setup bar. Now of course, you're going to have to come up with an exit strategy for this entry setup, but some sort of short-term moving average (like a two-period moving average of the daily highs or lows, etc.) should be able to do the job well. You could also use a profit target (based on current volatility) or even a time-based or n-number of bars exit. Do plenty of testing to see which works best for your own risk tolerance. |
|
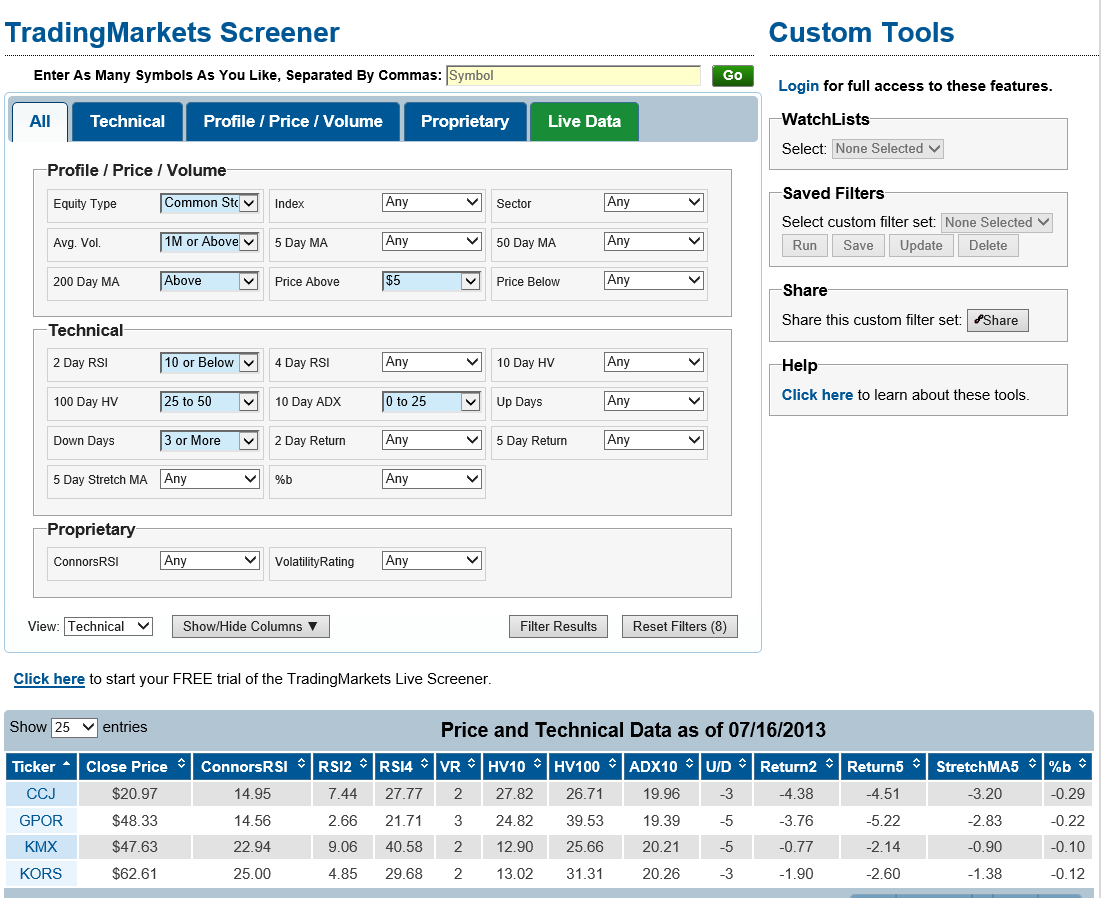
| Figure 2. Four stocks were identified as possible long pullback candidates, depending on a trader's own unique screener inputs and trading methodology. |
| Graphic provided by: TradeStation. |
| Graphic provided by: Trading Markets Live Screener. |
| |
| For an extra edge, using a market screening tool can help you weed out stocks that may already be in strong trending phases – pullback trading may work best in a range bound market, depending on the kinds of stocks you trade. The Trading Markets Live Screener can help you find stocks that have a 10-day Average Directional Movement (ADX) of 25 or less and which may already be in consolidations where overbought/oversold trading action can be a great boon for RSI-style oscillator entry methods. You can also choose to screen for stocks having especially high (or low) historical volatility, and that can also be a big assist to traders seeking to buy/sell short-term pullbacks. The screen shown in Figure 2 is looking for common stocks with: 1. A minimum of one million shares in average daily trading volume (50 days). 2. Daily historical volatility between 25 and 50 3. 10-day ADX below 25 4. Trading above its 200-day simple moving average (SMA) 5. Share price above $5 6. Has been falling in price for three or more days 7. Has a two-day RSI reading of 10 or below Basically, the screen wants to locate liquid, modest volatility stocks that aren't in an especially strong trend and which have pulled back for at least three trading sessions. The screen only takes a moment to run and this time it found four stocks – CCJ, GPOR, KMX, and KORS. Visual analysis of all four stocks in my TradeStation platform confirmed that KMX had the best and most consistent trading pattern, hence its inclusion here for your inspection. Now, as to the question of whether KMX is a good long pullback candidate right now, the answer is 'no' at least not yet! Remember, the money flow histogram is in the red (bearish) zone right now, with no sign yet of accumulation by the "smart money." Yes, the two-period RSI is "oversold" and price is getting close to that key Keltner midline, but the negative money flow puts the odds of success on a long trade entry here squarely against a trader. The best strategy now with KMX is to wait for a possible pullback to resistance (assuming it continues to fall first) with the RSI back above 90 again and then look to go short as long as the money flow is still in the red zone. If such a setup does appear, be sure to risk no more than one to two percent of your account value on this or any other trade, no matter how attractive it might be. Trade wisely until we meet here again. |
Freelance financial markets writer and online publisher of the Trendzetterz.com S&P 500 Weekly Forecast service.
| Title: | Market consultant and writer |
| Company: | Trendzetterz |
| Address: | 81 Hickory Hollow Drive |
| Crossville, TN 38555 | |
| Phone # for sales: | 904-303-4814 |
| Website: | trendzetterz.com |
| E-mail address: | support@trendzetterz.com |
Traders' Resource Links | |
| Trendzetterz has not added any product or service information to TRADERS' RESOURCE. | |
Click here for more information about our publications!
Comments

Request Information From Our Sponsors
- StockCharts.com, Inc.
- Candle Patterns
- Candlestick Charting Explained
- Intermarket Technical Analysis
- John Murphy on Chart Analysis
- John Murphy's Chart Pattern Recognition
- John Murphy's Market Message
- MurphyExplainsMarketAnalysis-Intermarket Analysis
- MurphyExplainsMarketAnalysis-Visual Analysis
- StockCharts.com
- Technical Analysis of the Financial Markets
- The Visual Investor
- VectorVest, Inc.
- Executive Premier Workshop
- One-Day Options Course
- OptionsPro
- Retirement Income Workshop
- Sure-Fire Trading Systems (VectorVest, Inc.)
- Trading as a Business Workshop
- VectorVest 7 EOD
- VectorVest 7 RealTime/IntraDay
- VectorVest AutoTester
- VectorVest Educational Services
- VectorVest OnLine
- VectorVest Options Analyzer
- VectorVest ProGraphics v6.0
- VectorVest ProTrader 7
- VectorVest RealTime Derby Tool
- VectorVest Simulator
- VectorVest Variator
- VectorVest Watchdog