

HOT TOPICS LIST
- MACD
- Fibonacci
- RSI
- Gann
- ADXR
- Stochastics
- Volume
- Triangles
- Futures
- Cycles
- Volatility
- ZIGZAG
- MESA
- Retracement
- Aroon
INDICATORS LIST
LIST OF TOPICS
PRINT THIS ARTICLE
by Donald W. Pendergast, Jr.
Shares of Globus Medical Inc. are setting up for a new long swing trade entry.
Position: N/A
Donald W. Pendergast, Jr.
Freelance financial markets writer and online publisher of the Trendzetterz.com S&P 500 Weekly Forecast service.
PRINT THIS ARTICLE
PRICE OSCILLATOR
GMED: 3/10 Oscillator Signalling A Buy
07/16/13 04:07:05 PMby Donald W. Pendergast, Jr.
Shares of Globus Medical Inc. are setting up for a new long swing trade entry.
Position: N/A
| The major US stock indexes surged higher again on July 11, 2013; here's one of the more attractive swing trade buy setups that resulted from the bullish action. |
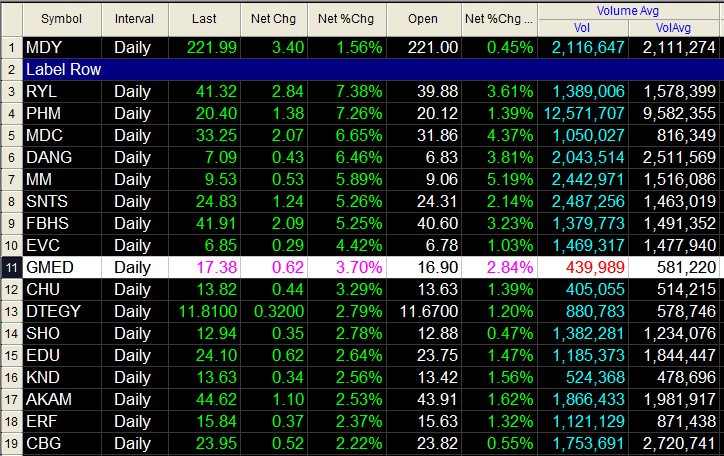
|
| Figure 1. GMED posts a 3.70% daily gain on Thursday July 11, 2013; many of the other stocks shown here have also had good earnings reports of late. |
| Graphic provided by: TradeStation. |
| Graphic provided by: TradeStation Radar Screen. |
| |
| I don't know about you, but I keep getting these 'doom and gloom' kind of 'sell stocks now!' and 'major depression ahead!' newsletters in my postal mailbox; you know the kind – they typically call for a crash that will send the Dow spiraling ever lower until it bottoms somewhere around 3,000 in 2015 and that unemployment will hit 25% within the next few years. While these make for entertaining reading (and perhaps there is a big correction – but not a crash – coming in late 2013), what traders and investors need to be focused on is the 'here and now' price action in the major US stock indexes; the Dow 30 and S&P 100/400/500 indexes are approaching their all-time record highs again even as the Russell 2000 index keeps making new record highs on a daily basis, and to have missed out on the rallies of the past eight months would have been such a tragic, lost opportunity indeed. The stock we'll look at now looks to be in prime position to rally by one to two dollars per share over the next one to two weeks, especially if the broad US markets keep on trucking higher; the stock is Globus Medical Inc. (GMED) and it features all of these bullish technicals: 1. Its long-term money flow trend still shows strong accumulation by the "smart money" players in the market. 2. Its 3/10 oscillator has just triggered a buy signal, one that gets the green light if GMED rises above 17.54. 3. The stock is trading near the upper end of a beautiful bull flag pattern and is close to a breakout. 4. The stock has excellent earnings growth potential and a large institutional following. 5. GMED beat its last two quarterly earnings estimates (next earnings release is for August 20, 2013). Looking at GMED's daily chart in Figure 2, it's easy to see how choppy and volatile this stock can be, even in the midst of a modest uptrend; with the prospect of a continuation move higher now in sight. However, skilled swing traders should have little trouble seeing the potential for a one to two dollar rally up and out of the bullish flag pattern over the next week or two. |
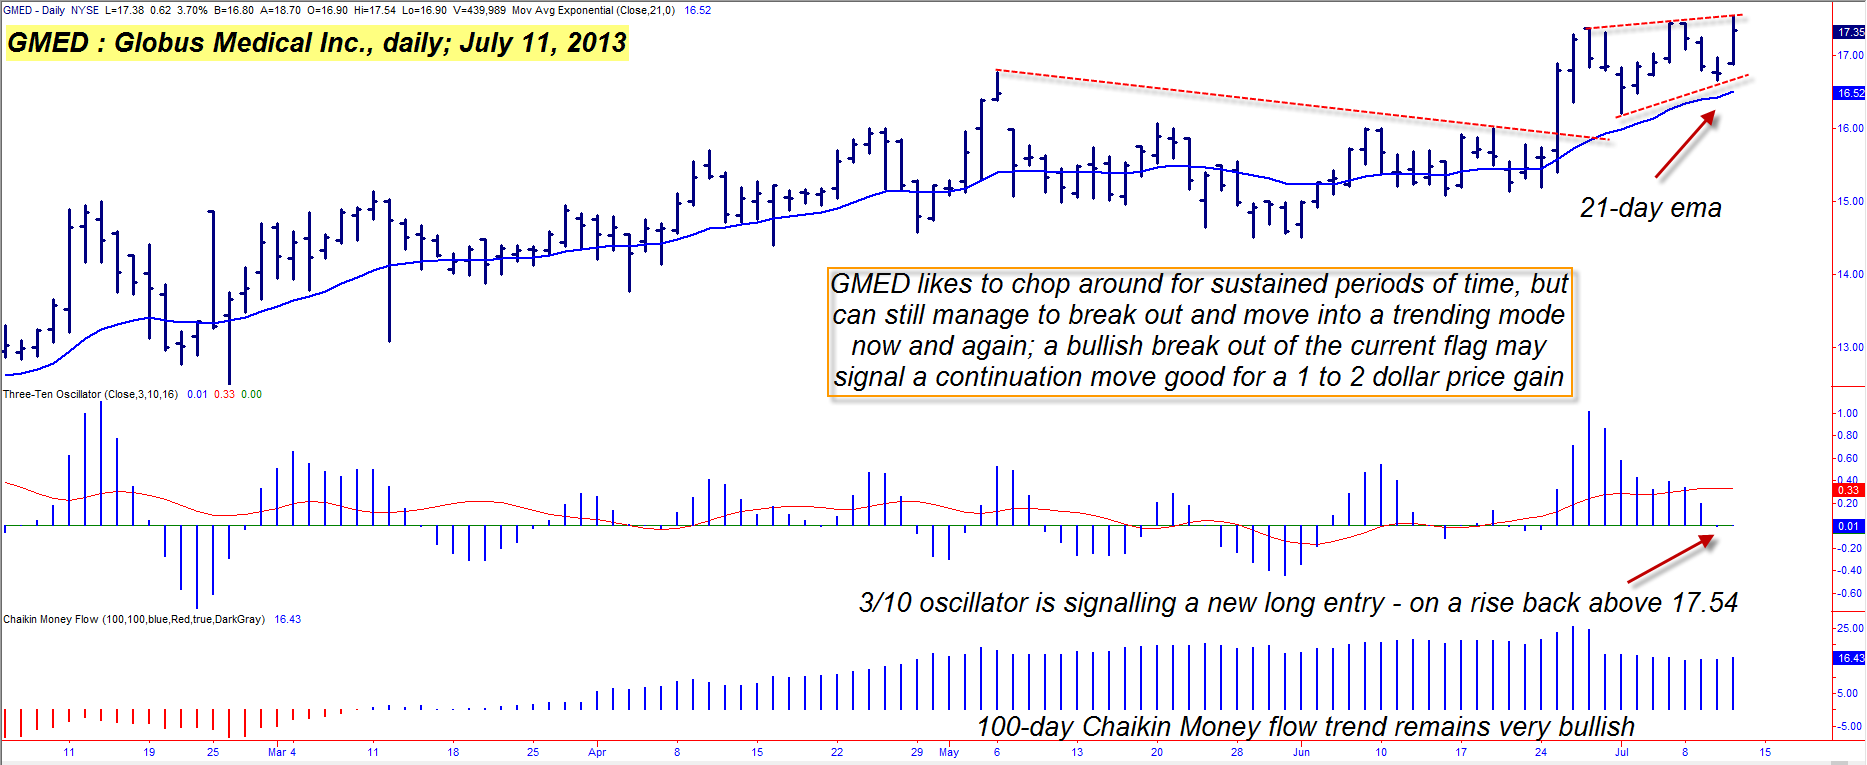
|
| Figure 2. GMED's long term money flow trend helps provide a very bullish looking foundation for a possible long breakout entry; a rise back above 17.54 should bring in a new wave of retail buyers. |
| Graphic provided by: TradeStation. |
| |
| Given that we have a super bullish (for the moment!) broad market scenario playing out, that GMED is a fundamentally attractive stock that is flashing several "no-brainer" buy signals, the biggest decision a swing trader needs to make here is how much to risk on this trade. Given the uber-bullishness in the big stock indexes, a 2% account risk might be appropriate here, but no more than that. Also, covered calls are not advised here as the bid/ask spread in GMED calls (and puts) is just too wide and the open interest figures are rather pathetic, too. So, playing the move with straight stock seems the only way to go; consider using a three bar trailing stop of the daily lows for this move and if you have more than $1.50 per share in open gains at some point, consider taking at least half of your profits, letting the rest run until final stop out. Trade wisely until we meet here again. |
Freelance financial markets writer and online publisher of the Trendzetterz.com S&P 500 Weekly Forecast service.
| Title: | Market consultant and writer |
| Company: | Trendzetterz |
| Address: | 81 Hickory Hollow Drive |
| Crossville, TN 38555 | |
| Phone # for sales: | 904-303-4814 |
| Website: | trendzetterz.com |
| E-mail address: | support@trendzetterz.com |
Traders' Resource Links | |
| Trendzetterz has not added any product or service information to TRADERS' RESOURCE. | |
Click here for more information about our publications!
Comments

Request Information From Our Sponsors
- VectorVest, Inc.
- Executive Premier Workshop
- One-Day Options Course
- OptionsPro
- Retirement Income Workshop
- Sure-Fire Trading Systems (VectorVest, Inc.)
- Trading as a Business Workshop
- VectorVest 7 EOD
- VectorVest 7 RealTime/IntraDay
- VectorVest AutoTester
- VectorVest Educational Services
- VectorVest OnLine
- VectorVest Options Analyzer
- VectorVest ProGraphics v6.0
- VectorVest ProTrader 7
- VectorVest RealTime Derby Tool
- VectorVest Simulator
- VectorVest Variator
- VectorVest Watchdog
- StockCharts.com, Inc.
- Candle Patterns
- Candlestick Charting Explained
- Intermarket Technical Analysis
- John Murphy on Chart Analysis
- John Murphy's Chart Pattern Recognition
- John Murphy's Market Message
- MurphyExplainsMarketAnalysis-Intermarket Analysis
- MurphyExplainsMarketAnalysis-Visual Analysis
- StockCharts.com
- Technical Analysis of the Financial Markets
- The Visual Investor