

HOT TOPICS LIST
- MACD
- Fibonacci
- RSI
- Gann
- ADXR
- Stochastics
- Volume
- Triangles
- Futures
- Cycles
- Volatility
- ZIGZAG
- MESA
- Retracement
- Aroon
INDICATORS LIST
LIST OF TOPICS
PRINT THIS ARTICLE
by Donald W. Pendergast, Jr.
Shares of E-Commerce China Dangdang Inc. have covered a great deal of ground over the past nine weeks, with a new buying opportunity now appearing.
Position: N/A
Donald W. Pendergast, Jr.
Freelance financial markets writer and online publisher of the Trendzetterz.com S&P 500 Weekly Forecast service.
PRINT THIS ARTICLE
OPTIONS TRADING
DANG: A Prime Long Re-Entry Point?
07/15/13 04:59:58 PMby Donald W. Pendergast, Jr.
Shares of E-Commerce China Dangdang Inc. have covered a great deal of ground over the past nine weeks, with a new buying opportunity now appearing.
Position: N/A
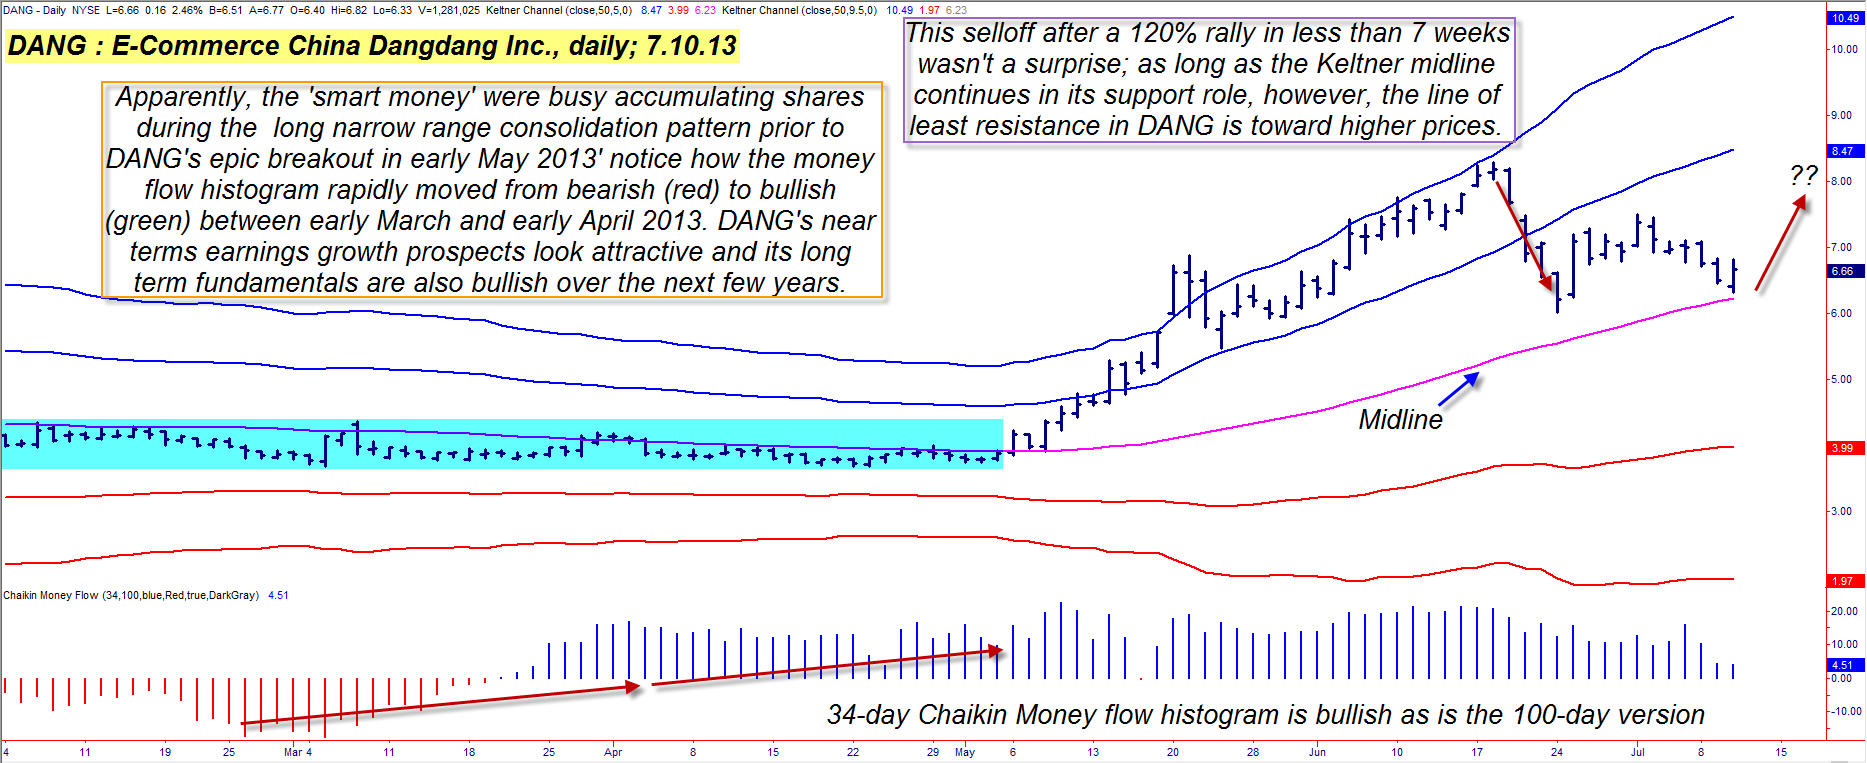
| Anyone who can remember the world before online banking and e-commerce enablers like PayPal changed the way consumers deal with bill payments and Internet purchases can probably appreciate the potential for a company that aims to profit from the rapidly growing e-commerce business in China – a nation of more than 1.3 billion people. And judging from the nearly textbook-quality stock accumulation pattern depicted on the chart in Figure 1, it seems a safe guess that the so-called "smart money" interests in the stock market had already taken notice of E-Commerce China Dangdang Inc. (DANG) long before the average retail investor did. They most certainly were busy accumulating shares of this stock between November 2012 and May 2013 as DANG put in a major long-term basing pattern. The patience required for the stock to eventually surge again was well worth the wait, however, as it rocketed from 3.76 on May 2, 2013 to 8.28 by June 18, 2013. Note how the stock surged when it crossed the Keltner channel mid-line during the initial stages of the breakout and how the money flow histogram began to make similarly high peaks at each stage of the rally. Of course, even a fundamentally strong stock has to correct sometime, and in DANG's case, its final ascent up to the upper Keltner band (set at a whopping 9.5 ATRs away from a 50-day simple moving average (SMA) was the warning sign that the stock was nearing a statistically probable correction/pause zone. Sure enough, the stock pulled back hard in late June 2013, bounced a bit, and has now pulled back again, making a higher daily low in the process. |
|
| Figure 1. DANG's daily chart presents a picture of a stock completing (or in the process of completing) a proportional pullback in the midst of a longer term bull market. |
| Graphic provided by: TradeStation. |
| |
| So, what do we have staring us in the face on DANG's daily chart anyway? 1. A stock with great earnings growth potential over the next 6-12 months. 2. A stock that made an awesome breakout, followed by a 120% gain in seven weeks. 3. A stock that has made a proportional correction back to a key support area and is now beginning to rally again. Now, if you're a long-term position trader, you might consider putting on a position now and be done with it. Just monitor the longer term charts and trend lines to guide you with your ultimate exit strategy. If, however, you want to try for a near-term, no long-term commitment kind of play, why not consider selling either the August or September '13 $6.00 DANG put option(s)? If you see DANG break above the 6.75 level again, consider selling either of those puts, looking to capitalize on the two key advantages of selling out-of-the-money, close-expiration puts on a rallying stock: A. Rapid daily time decay factors. B. Rapidly shrinking deltas. |
|
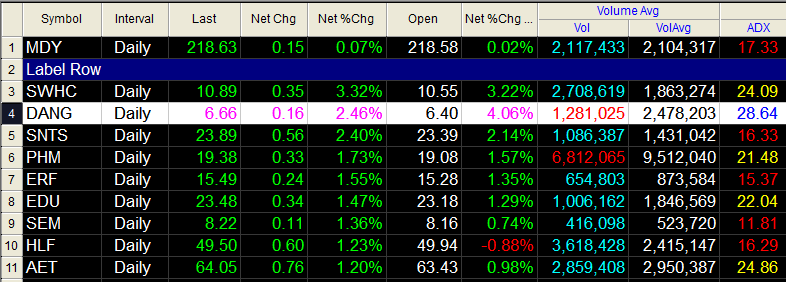
| Figure 2. DANG posted impressive daily gains by the end of the July 10, 2013 trading session. A rally above 6.75 may prove to be a valid long entry signal. |
| Graphic provided by: TradeStation. |
| Graphic provided by: TradeStation Radar Screen. |
| |
| You don't need too much of a rally to gain the assistance of both of these option selling "edges" and if DANG does continue to rise, the puts will quickly lose value and can be bought back at just a fraction of the selling price. To manage the risk however, consider running a three to five bar trailing stop of the daily lows until either the option declines in value by 60 to 70% or the stop gets hit, whichever happens first. Also, the bid/ask spread is a little better on the September puts and the $6.00 strike has far greater open interest and liquidity than does its August '13 counterpart. However, both look like good, modest risk, long trades for skilled option sellers. Remember to keep your account risk at 2% or less and be sure to keep close watch on any short option (or stock) trades you have on in the market. Trade wisely until we meet here again. |
Freelance financial markets writer and online publisher of the Trendzetterz.com S&P 500 Weekly Forecast service.
| Title: | Market consultant and writer |
| Company: | Trendzetterz |
| Address: | 81 Hickory Hollow Drive |
| Crossville, TN 38555 | |
| Phone # for sales: | 904-303-4814 |
| Website: | trendzetterz.com |
| E-mail address: | support@trendzetterz.com |
Traders' Resource Links | |
| Trendzetterz has not added any product or service information to TRADERS' RESOURCE. | |
Click here for more information about our publications!
PRINT THIS ARTICLE

Request Information From Our Sponsors
- VectorVest, Inc.
- Executive Premier Workshop
- One-Day Options Course
- OptionsPro
- Retirement Income Workshop
- Sure-Fire Trading Systems (VectorVest, Inc.)
- Trading as a Business Workshop
- VectorVest 7 EOD
- VectorVest 7 RealTime/IntraDay
- VectorVest AutoTester
- VectorVest Educational Services
- VectorVest OnLine
- VectorVest Options Analyzer
- VectorVest ProGraphics v6.0
- VectorVest ProTrader 7
- VectorVest RealTime Derby Tool
- VectorVest Simulator
- VectorVest Variator
- VectorVest Watchdog
- StockCharts.com, Inc.
- Candle Patterns
- Candlestick Charting Explained
- Intermarket Technical Analysis
- John Murphy on Chart Analysis
- John Murphy's Chart Pattern Recognition
- John Murphy's Market Message
- MurphyExplainsMarketAnalysis-Intermarket Analysis
- MurphyExplainsMarketAnalysis-Visual Analysis
- StockCharts.com
- Technical Analysis of the Financial Markets
- The Visual Investor