HOT TOPICS LIST
- MACD
- Fibonacci
- RSI
- Gann
- ADXR
- Stochastics
- Volume
- Triangles
- Futures
- Cycles
- Volatility
- ZIGZAG
- MESA
- Retracement
- Aroon
INDICATORS LIST
LIST OF TOPICS
PRINT THIS ARTICLE
by Koos van der Merwe
Investing in Canadian stocks can provide an advantage, and when a stock signals a buy signal, it's worth looking at.
Position: Buy
Koos van der Merwe
Has been a technical analyst since 1969, and has worked as a futures and options trader with First Financial Futures in Johannesburg, South Africa.
PRINT THIS ARTICLE
ELLIOTT WAVE
MacDonald, Dettwiler & Associates Ltd.
07/12/13 03:43:11 PMby Koos van der Merwe
Investing in Canadian stocks can provide an advantage, and when a stock signals a buy signal, it's worth looking at.
Position: Buy
| MacDonald, Dettwiler & Associates Ltd. provides ground-based and space-based information solutions that support the operational needs of government -- military and civilian -- and commercial customers worldwide. The company operates in two segments: communications, where it manufactures and integrates satellites; and surveillance & intelligence. When it gives me a buy signal in a market that is recovering from a correction, I take a serious look at it. |

|
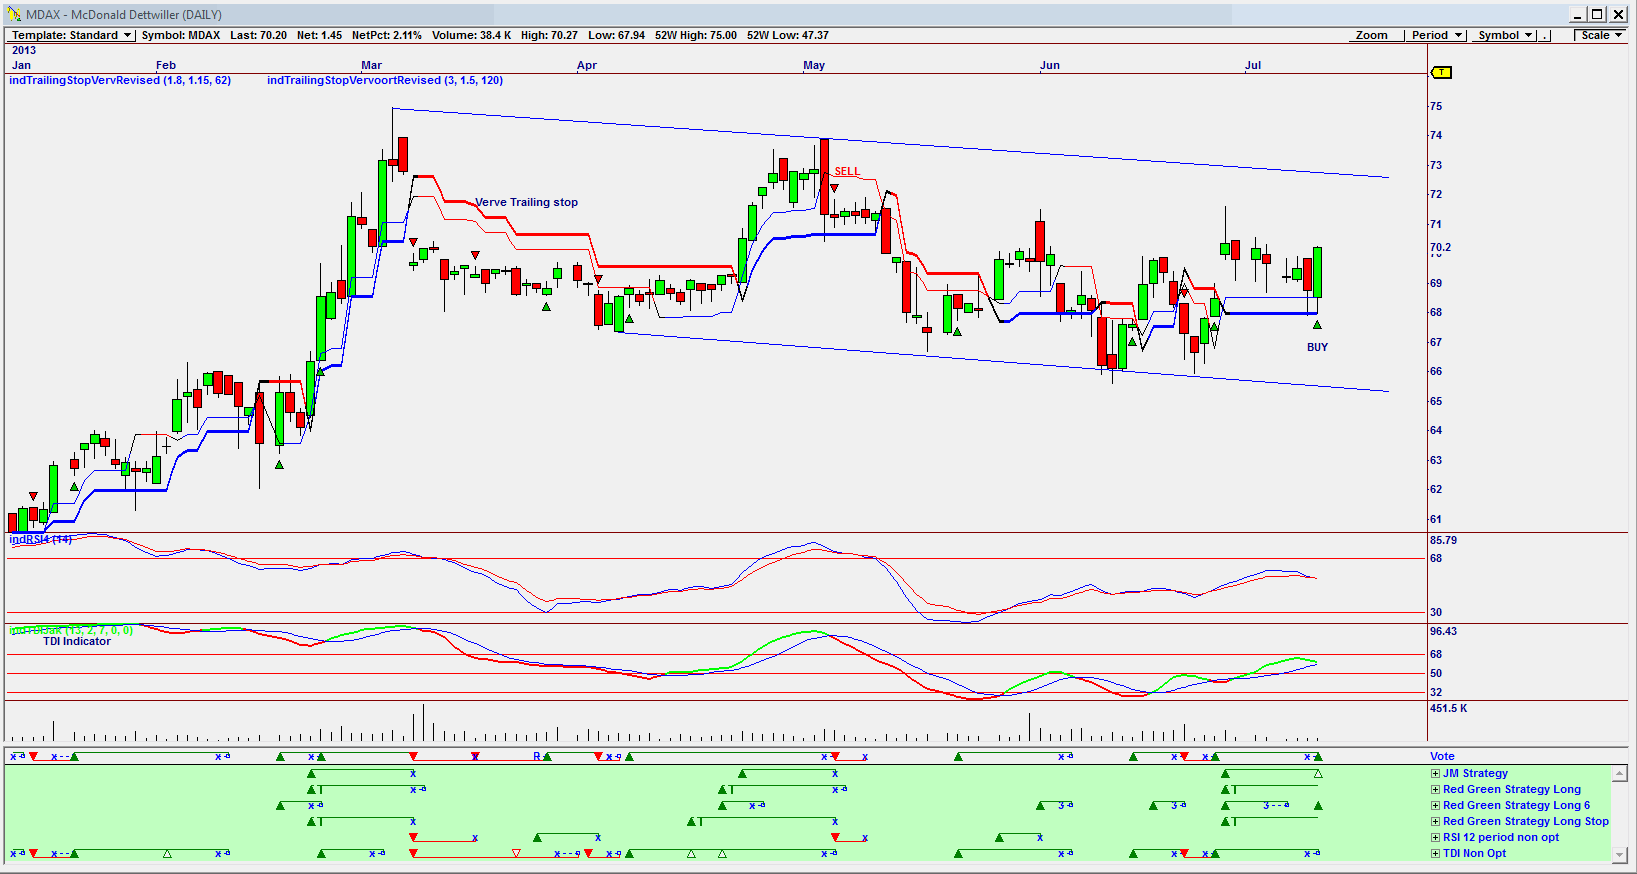
| Figure 1. Daily chart showing BUY signal. |
| Graphic provided by: Omnitrader. |
| |
| The daily chart in Figure 1 shows the buy signal given by the vote line. The final signal given is a combination of the strategies shown in green below the vote line. Eyeballing past buy & sell signals given by the vote line shows that by following their signals, the result would have been profitable. Note also that the pattern shown appears to be a flat pattern (see Figure 2). The RSI (relative strength index) shown is in a positive trend, but the TDI (trend detection index) looks negative. |

|
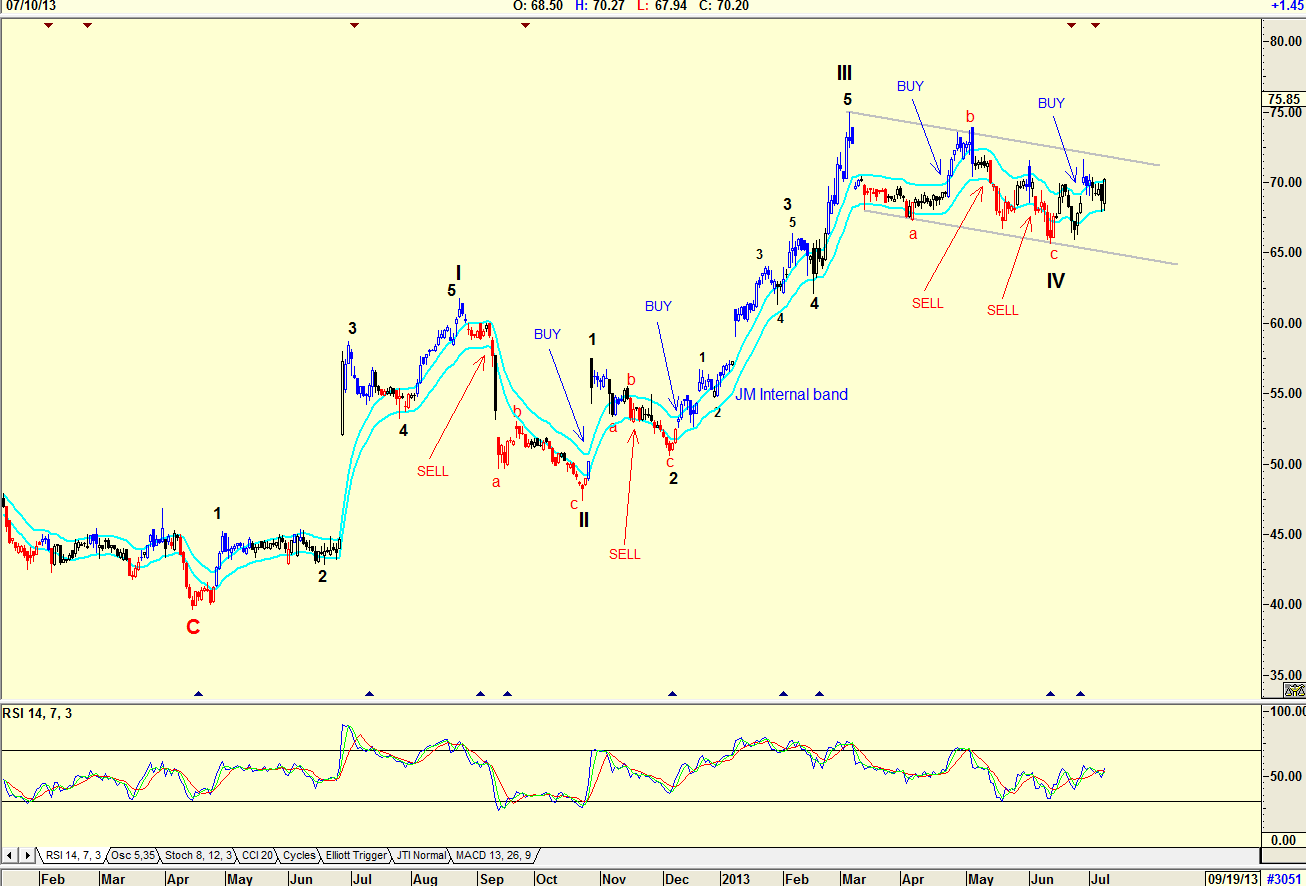
| Figure 2. Daily Chart showing Elliott Wave Count |
| Graphic provided by: AdvancedGET. |
| |
| The chart in Figure 2 is an Elliott wave count of the share. It suggests that the flag pattern shown is a WAVE 4 correction. The flag pattern is suggesting that should the price break out at $71.95, the target is $93.60 (75.21-47.31=27.90+65.70=93.60). Note the RSI, which is in buy mode. Note the JM internal band buy & sell signal. A JM internal band is a 15-period simple moving average offset by 2% positive and 2% negative. |

|
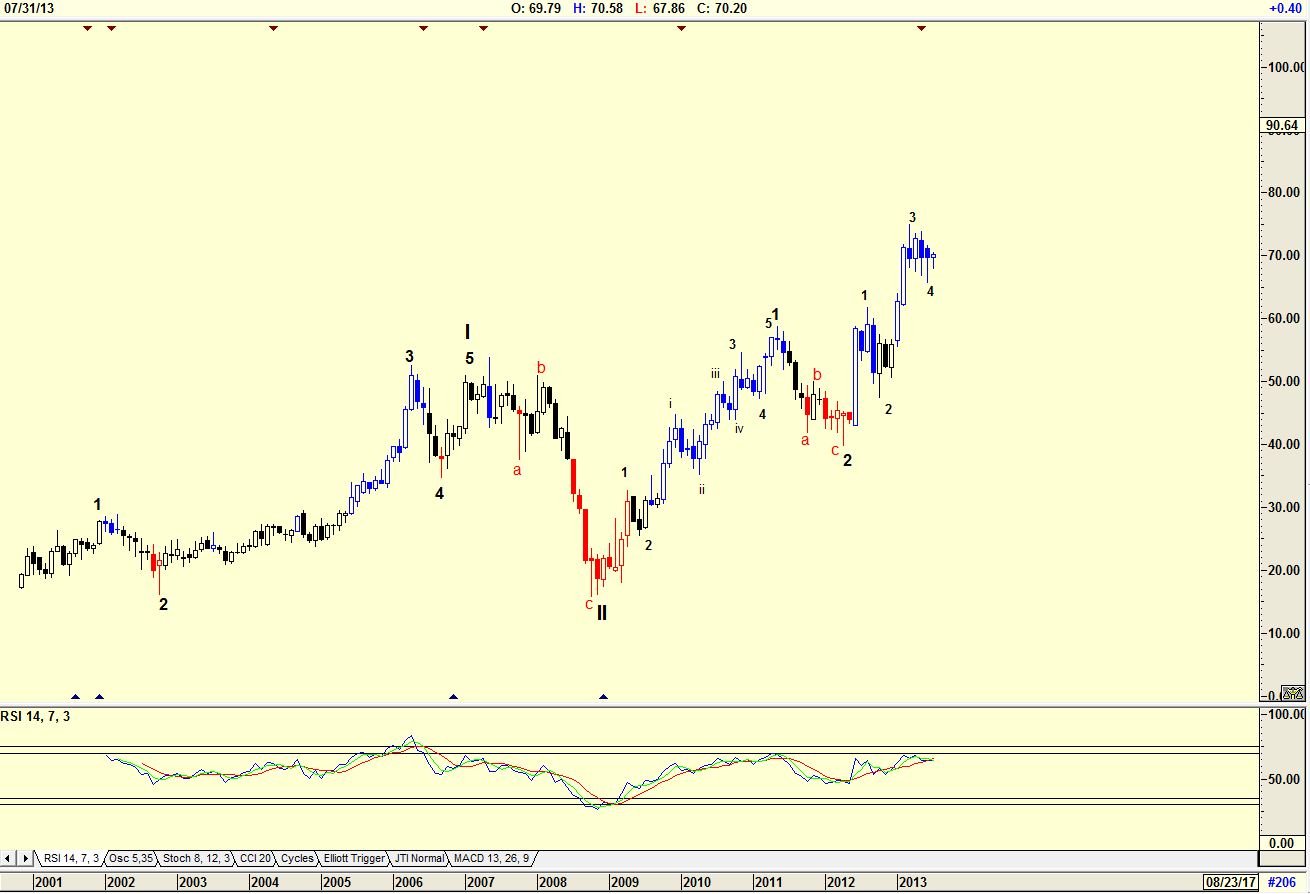
| Figure 3. Monthly Chart showing Elliott Wave count |
| Graphic provided by: AdvancedGET. |
| |
| The monthly chart in Figure 3 shows an Elliott wave count that suggests the price could be moving into a wave 5 of WAVE 3 of WAVE III. This is a bullish pattern. The RSI indicator is still bullish. I would be a buyer of McDonald, Dettwiler & Associates shares at the present price for a long-term hold. |
Has been a technical analyst since 1969, and has worked as a futures and options trader with First Financial Futures in Johannesburg, South Africa.
| Address: | 3256 West 24th Ave |
| Vancouver, BC | |
| Phone # for sales: | 6042634214 |
| E-mail address: | petroosp@gmail.com |
Click here for more information about our publications!
Comments

|

Request Information From Our Sponsors
- StockCharts.com, Inc.
- Candle Patterns
- Candlestick Charting Explained
- Intermarket Technical Analysis
- John Murphy on Chart Analysis
- John Murphy's Chart Pattern Recognition
- John Murphy's Market Message
- MurphyExplainsMarketAnalysis-Intermarket Analysis
- MurphyExplainsMarketAnalysis-Visual Analysis
- StockCharts.com
- Technical Analysis of the Financial Markets
- The Visual Investor
- VectorVest, Inc.
- Executive Premier Workshop
- One-Day Options Course
- OptionsPro
- Retirement Income Workshop
- Sure-Fire Trading Systems (VectorVest, Inc.)
- Trading as a Business Workshop
- VectorVest 7 EOD
- VectorVest 7 RealTime/IntraDay
- VectorVest AutoTester
- VectorVest Educational Services
- VectorVest OnLine
- VectorVest Options Analyzer
- VectorVest ProGraphics v6.0
- VectorVest ProTrader 7
- VectorVest RealTime Derby Tool
- VectorVest Simulator
- VectorVest Variator
- VectorVest Watchdog
