HOT TOPICS LIST
- MACD
- Fibonacci
- RSI
- Gann
- ADXR
- Stochastics
- Volume
- Triangles
- Futures
- Cycles
- Volatility
- ZIGZAG
- MESA
- Retracement
- Aroon
INDICATORS LIST
LIST OF TOPICS
PRINT THIS ARTICLE
by Gary Grosschadl
The XAU gold index and most golds have had quite the run since the successful pullback test. Daily charts and a softening of spot price both suggest a small retracement is likely before the next upthrust.
Position: N/A
Gary Grosschadl
Independent Canadian equities trader and technical analyst based in Peterborough
Ontario, Canada.
PRINT THIS ARTICLE
GOLD & METALS
Gold Still Bullish But Due For A Breather
09/10/02 11:49:42 AMby Gary Grosschadl
The XAU gold index and most golds have had quite the run since the successful pullback test. Daily charts and a softening of spot price both suggest a small retracement is likely before the next upthrust.
Position: N/A
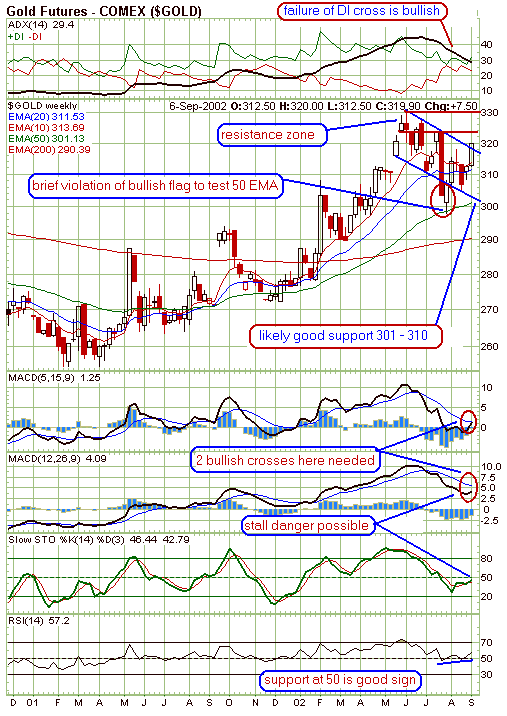
| Looking at the weekly chart for the price of gold, I have marked the bullish potential going forward for gold to challenge its previous top of $330, and perhaps spike a bit higher. On Monday spot price backed off from $324, making the immediate resistance level $325. A movement through this level should bring some excitement, the danger being it could be short-lived as this gold market remains reversal oriented. |
| Despite the brief violation of the bullish flag, it still looks intact. Failure of a bearish crossover of the ADX's directional movement indicators is a bullish sign of strength going forward. |

|
| Graphic provided by: stockcharts.com. |
| |
| In the short-term a retracement is likely (as discussed) and support should be between $301 and $310. There is stronger support at $290, the 200-day EMA level, but I don't anticipate a move there and I would be wary of a drop below $300. The MACD series and stochastics show the possibility of a stall zone which would tie in with a brief retracement. Failure of both MACD series to cross over signaling a bullish uptrend, and failure of stochastics to rise above 50 could coincide with this "breather." Likewise an eventual positive move here should signal the next bullish assault into the resistance zone as marked. A move below $300 and all bullish bets are off. |
Independent Canadian equities trader and technical analyst based in Peterborough
Ontario, Canada.
| Website: | www.whatsonsale.ca/financial.html |
| E-mail address: | gwg7@sympatico.ca |
Click here for more information about our publications!
Comments
Date: 09/14/02Rank: 4Comment:
Date: 09/17/02Rank: 5Comment:
Date: 09/17/02Rank: 5Comment:
Date: 09/24/02Rank: 4Comment: i am a new trader and i wanna work in gold, how shld i start with it and what books i shld read

Request Information From Our Sponsors
- StockCharts.com, Inc.
- Candle Patterns
- Candlestick Charting Explained
- Intermarket Technical Analysis
- John Murphy on Chart Analysis
- John Murphy's Chart Pattern Recognition
- John Murphy's Market Message
- MurphyExplainsMarketAnalysis-Intermarket Analysis
- MurphyExplainsMarketAnalysis-Visual Analysis
- StockCharts.com
- Technical Analysis of the Financial Markets
- The Visual Investor
- VectorVest, Inc.
- Executive Premier Workshop
- One-Day Options Course
- OptionsPro
- Retirement Income Workshop
- Sure-Fire Trading Systems (VectorVest, Inc.)
- Trading as a Business Workshop
- VectorVest 7 EOD
- VectorVest 7 RealTime/IntraDay
- VectorVest AutoTester
- VectorVest Educational Services
- VectorVest OnLine
- VectorVest Options Analyzer
- VectorVest ProGraphics v6.0
- VectorVest ProTrader 7
- VectorVest RealTime Derby Tool
- VectorVest Simulator
- VectorVest Variator
- VectorVest Watchdog
