HOT TOPICS LIST
- MACD
- Fibonacci
- RSI
- Gann
- ADXR
- Stochastics
- Volume
- Triangles
- Futures
- Cycles
- Volatility
- ZIGZAG
- MESA
- Retracement
- Aroon
INDICATORS LIST
LIST OF TOPICS
PRINT THIS ARTICLE
by Donald W. Pendergast, Jr.
Up by nearly 8% in the past couple of weeks, the iShares Russell 2000 index ETF looks vulnerable to profit-takers.
Position: N/A
Donald W. Pendergast, Jr.
Freelance financial markets writer and online publisher of the Trendzetterz.com S&P 500 Weekly Forecast service.
PRINT THIS ARTICLE
TECHNICAL ANALYSIS
IWM: Ripe For Profit-Taking?
07/11/13 04:18:12 PMby Donald W. Pendergast, Jr.
Up by nearly 8% in the past couple of weeks, the iShares Russell 2000 index ETF looks vulnerable to profit-takers.
Position: N/A
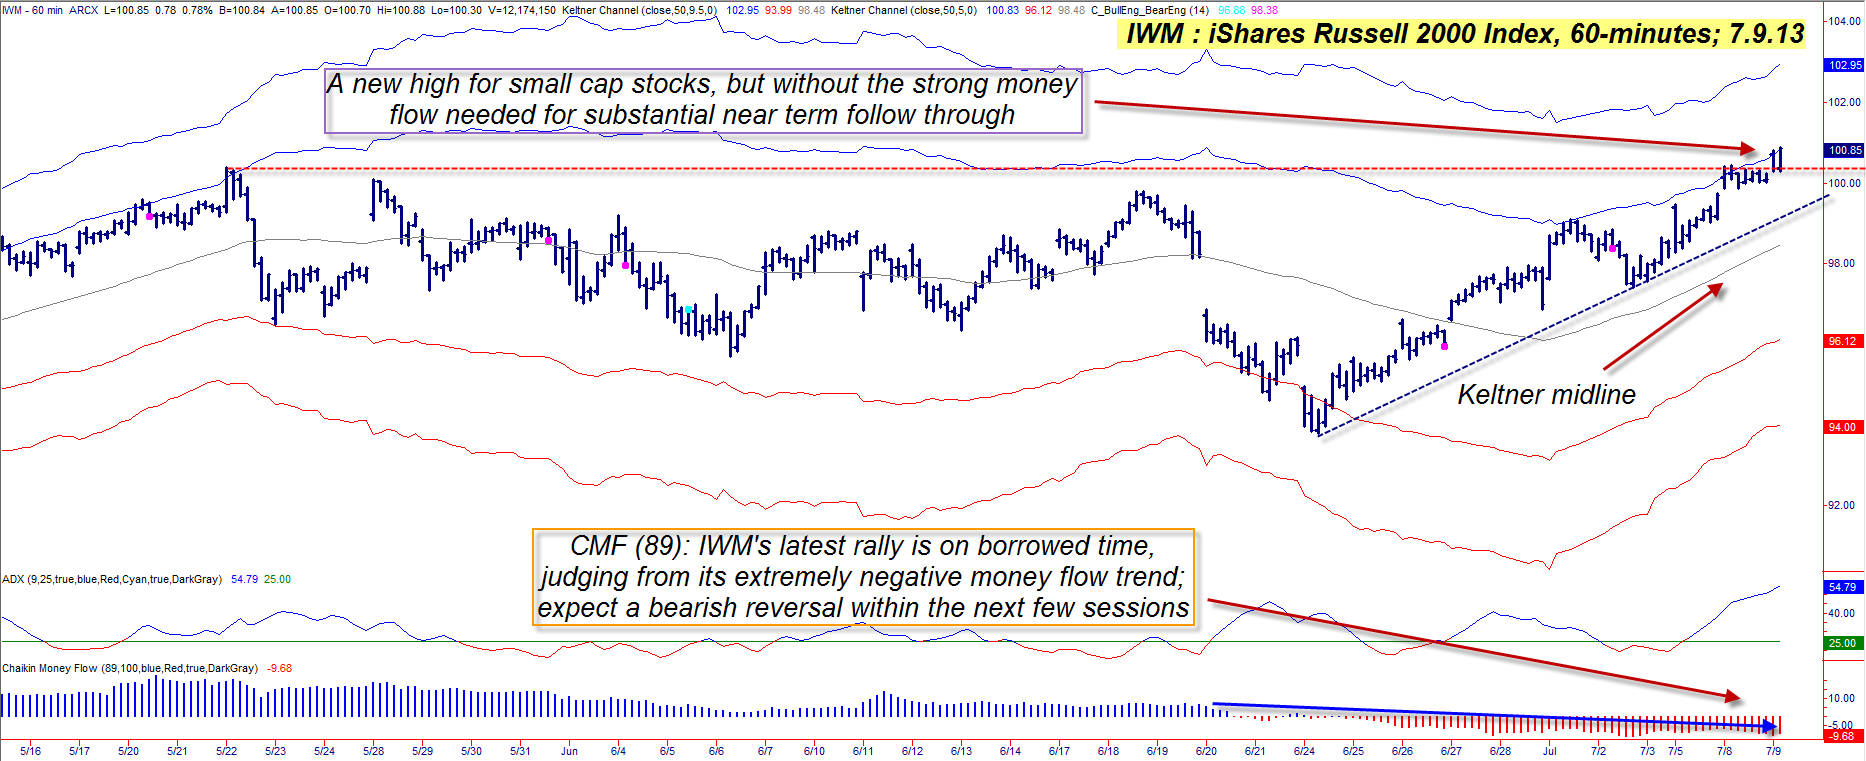
| After the recent five-week-long broad market correction ended with a significant cycle low on June 24, 2013, all of the major stock indexes began to rally again; whether or not this is the start of a new upleg that is destined to carry those indexes to even greater all-time highs, it is becoming more clear to technicians that this recent surge higher is getting to be vulnerable to a correction -- and probably sooner rather than later. Here's a closer look at the 60-minute chart of the iShares Russell 2000 index ETF (IWM). |

|
| Figure 1: IWM is manifesting bearish price/money flow divergences on its 60-minute and daily time frames; look for a correction soon to rectify this imbalance. |
| Graphic provided by: TradeStation. |
| |
| The major US stock indexes are still in bullish mode, especially if using the November 2012 lows as a starting point for the large-scale rallies that launched out of that meaningful, major multicycle low -- rallies that took the Dow 30, S&P 500, and Russell 2000 indexes to new all-time highs. Naturally, traders and investors have the right to give the latest surge higher every benefit of the doubt -- as it could indeed be going on to even higher all-time highs -- but to skilled technicians, it already appears that this bull run is just about out of gas. Take a look at the 89-period Chaikin money flow histogram (CMF)(89) in Figure 1 and you can clearly see that it is well into the "red" zone -- way below its zero line -- which is telling savvy traders/investors that distribution is under way and that a correction is imminent. In fact, the money flow weakness is suggesting that the larger-scale run higher since November 2012 is also due to undergo even deeper setbacks than those witnessed in May/June 2013. That's because on the daily chart for IWM the same 89-period money flow histogram (CMF)(89) has failed to make a higher high along with price, again confirming that distribution is already under way. |

|
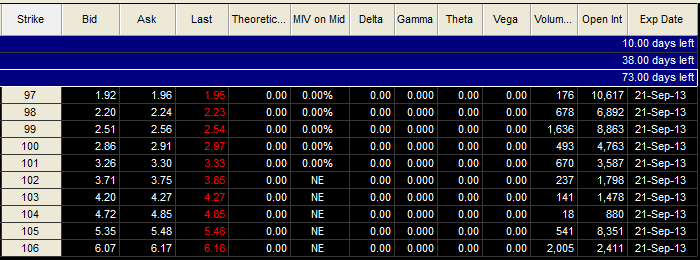
| Figure 2.: Of the September '13 IWM put options shown here, those at the $97.00 strike price have the heaviest open interest. |
| Graphic provided by: TradeStation. |
| Graphic provided by: TradeStation Options Analysis. |
| |
| IWM's 60-minute chart is even offering some helpful technical clues that can alert current longs when to finally bail out even as it may help speculative bears decide on a good shorting point: The blue dashed uptrend line, once violated on a 60-minute closing basis, will be the "everybody out of the pool" alert, especially for all existing longs in IWM. In fact, if you are holding large amounts of small- and mid-cap stocks, you may also want to lighten up your holdings on those, especially if their own 60-minute chart patterns mimic that of IWM's. By the way, just below that uptrend line lies the Keltner midline (this one based on a 50-period moving average) and should that key support level also be taken out, you'll really have great confirmation that the rally launched on June 24, 2013 is history. Until that happens, it might be a good use of time to put together a list of fundamentally weak small caps that are shortable (or that you can buy put options on) so that you can capitalize on the next downdraft in the major stock indexes. You can also investigate the possibility of buying slightly in-the-money IWM puts with two to three months of time value before expiration; that's plenty of option life to capitalize on a 60-minute chart downtrend, and it might also work for traders using daily chart sell signals. |
| Trade wisely until we meet here again. |
Freelance financial markets writer and online publisher of the Trendzetterz.com S&P 500 Weekly Forecast service.
| Title: | Market consultant and writer |
| Company: | Trendzetterz |
| Address: | 81 Hickory Hollow Drive |
| Crossville, TN 38555 | |
| Phone # for sales: | 904-303-4814 |
| Website: | trendzetterz.com |
| E-mail address: | support@trendzetterz.com |
Traders' Resource Links | |
| Trendzetterz has not added any product or service information to TRADERS' RESOURCE. | |
Click here for more information about our publications!
Comments

Request Information From Our Sponsors
- VectorVest, Inc.
- Executive Premier Workshop
- One-Day Options Course
- OptionsPro
- Retirement Income Workshop
- Sure-Fire Trading Systems (VectorVest, Inc.)
- Trading as a Business Workshop
- VectorVest 7 EOD
- VectorVest 7 RealTime/IntraDay
- VectorVest AutoTester
- VectorVest Educational Services
- VectorVest OnLine
- VectorVest Options Analyzer
- VectorVest ProGraphics v6.0
- VectorVest ProTrader 7
- VectorVest RealTime Derby Tool
- VectorVest Simulator
- VectorVest Variator
- VectorVest Watchdog
- StockCharts.com, Inc.
- Candle Patterns
- Candlestick Charting Explained
- Intermarket Technical Analysis
- John Murphy on Chart Analysis
- John Murphy's Chart Pattern Recognition
- John Murphy's Market Message
- MurphyExplainsMarketAnalysis-Intermarket Analysis
- MurphyExplainsMarketAnalysis-Visual Analysis
- StockCharts.com
- Technical Analysis of the Financial Markets
- The Visual Investor
