

HOT TOPICS LIST
- MACD
- Fibonacci
- RSI
- Gann
- ADXR
- Stochastics
- Volume
- Triangles
- Futures
- Cycles
- Volatility
- ZIGZAG
- MESA
- Retracement
- Aroon
INDICATORS LIST
LIST OF TOPICS
PRINT THIS ARTICLE
by Billy Williams
Runaway stocks always start from breaking out from a base pattern. There are three keys to help you spot them over and over again.
Position: N/A
Billy Williams
Billy Williams has been trading the markets for 27 years, specializing in momentum trading with stocks and options.
PRINT THIS ARTICLE
BREAKOUTS
Three Keys To First Stage Base Patterns
07/15/13 04:53:09 PMby Billy Williams
Runaway stocks always start from breaking out from a base pattern. There are three keys to help you spot them over and over again.
Position: N/A
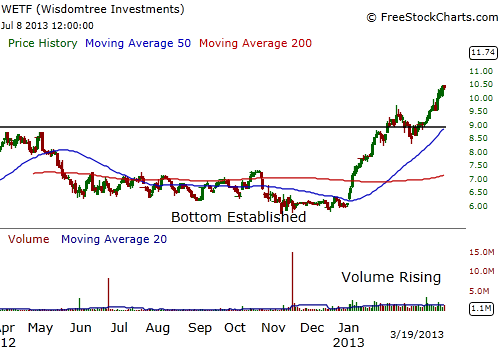
| Every traders hopes and dreams to catch that one big "monster stock" where they time their entry perfectly and ride the stock's move to breathtaking heights, scoring a 100% or greater gain. For many traders, beginning and experienced, catching a runaway stock like that is as elusive as Ahab's hunt for the great white whale. But, fortunately, there are some keys to finding high performing stocks that have the potential to make enormous gains, making it easier and more profitable than you might have originally thought. The first key that you have to understand about high-performing stocks is that their price action will tend to form first stage patterns. These patterns form when price is trading through two noticeable price levels – support and resistance – on low, but rising, trade volume. First stage base patterns can form as little as a few weeks to as long as a year or more. The best patterns take at least eight weeks to form. |
|
| Figure 1. Notice how price trades between support and resistance on Wisdomtree Investments as well as how the 50-day and 200-day SMA are flatlined on top of each other - an obvious sign of a base pattern. |
| Graphic provided by: www.freestockcharts.com. |
| |
| Having a 50-day SMA and a 200-day SMA will help you spot when these patterns are in effect as the moving averages will be trading sideways, almost on top of each other. Volume, the second key, was mentioned briefly and important because it helps you gauge whether the stock is under accumulation. Accumulation means that a major institution like a pension fund, hedge fund, or mutual fund, or a combination of all three, are taking a position in the stock. A stock in a first stage base pattern will have a daily average volume level but when a major investor begins to take a position, the volume level will begin to rise. Volume then becomes the "canary in the coal mine" that alerts you when accumulation is underway and signals a potential breakout to higher ground. |
|
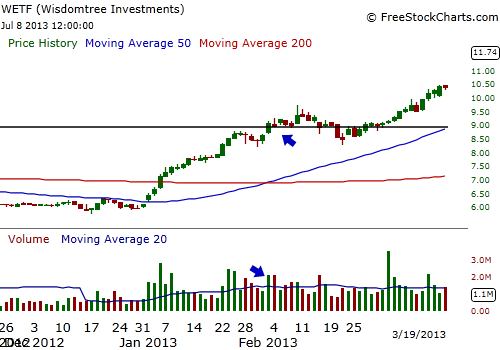
| Figure 2. Volume continued to rise until early 2013, when WETF traded higher until it broke out of its base pattern on higher volume gaining an almost 40% return until price pulled back. Every major stock winner has started out from this point which is why it is critical to find these early chart formations for big gains. |
| Graphic provided by: www.freestockcharts.com. |
| |
| But, before a stock can breakout from its base or attract major investors, it is preceded by earnings growth. Without strong earnings, none of the other things are likely to occur because earnings tell the tale of how strong the company is and how strong of a competitive advantage it has. All the major stock moves occurred after a series of strong quarterly earnings growth was reported, usually four consecutive quarters or more. Sometimes earnings growth falls short and the stock suffers as a result but if earnings are reported higher than expected, it can translate into a positive impact on the stock causing price to reach higher ground more than any other event. But to find stocks like this, you have to dig for them and they are usually small-cap stocks that have market valuations of $1 billion or less. |
| The good news is that stocks like these occur more than you might realize because noone pays attention to them until they reach new price highs and attract attention from the media and financial news networks. But, by then, it is usually time to sell and find another home run. Start looking for stocks that have impressive earnings growth for at least four quarters of consecutively higher growth than the next and look at the chart to see if price has formed a base pattern. Then, watch volume for signs of accumulation until the stock trades at the upper part of its base pattern and watch for it to break out on higher volume and take a position. If price gaps higher than the upper part of the base pattern's resistance level, then take a position even if the volume is light. Statistically, that type of price movement at the time of the breakout is still a valid signal into what could be an incredibly profitable run. |
Billy Williams has been trading the markets for 27 years, specializing in momentum trading with stocks and options.
| Company: | StockOptionSystem.com |
| E-mail address: | stockoptionsystem.com@gmail.com |
Traders' Resource Links | |
| StockOptionSystem.com has not added any product or service information to TRADERS' RESOURCE. | |
Click here for more information about our publications!
PRINT THIS ARTICLE

Request Information From Our Sponsors
- VectorVest, Inc.
- Executive Premier Workshop
- One-Day Options Course
- OptionsPro
- Retirement Income Workshop
- Sure-Fire Trading Systems (VectorVest, Inc.)
- Trading as a Business Workshop
- VectorVest 7 EOD
- VectorVest 7 RealTime/IntraDay
- VectorVest AutoTester
- VectorVest Educational Services
- VectorVest OnLine
- VectorVest Options Analyzer
- VectorVest ProGraphics v6.0
- VectorVest ProTrader 7
- VectorVest RealTime Derby Tool
- VectorVest Simulator
- VectorVest Variator
- VectorVest Watchdog
- StockCharts.com, Inc.
- Candle Patterns
- Candlestick Charting Explained
- Intermarket Technical Analysis
- John Murphy on Chart Analysis
- John Murphy's Chart Pattern Recognition
- John Murphy's Market Message
- MurphyExplainsMarketAnalysis-Intermarket Analysis
- MurphyExplainsMarketAnalysis-Visual Analysis
- StockCharts.com
- Technical Analysis of the Financial Markets
- The Visual Investor