HOT TOPICS LIST
- MACD
- Fibonacci
- RSI
- Gann
- ADXR
- Stochastics
- Volume
- Triangles
- Futures
- Cycles
- Volatility
- ZIGZAG
- MESA
- Retracement
- Aroon
INDICATORS LIST
LIST OF TOPICS
PRINT THIS ARTICLE
by Billy Williams
The market is showing some interesting price action and looks like it's making an attempt to trade higher but, like everything in life, you have to consider the context surrounding certain events.
Position: N/A
Billy Williams
Billy Williams has been trading the markets for 27 years, specializing in momentum trading with stocks and options.
PRINT THIS ARTICLE
PRICE/VOLUME TREND
Price, Volume, And The Road Ahead
07/15/13 04:47:28 PMby Billy Williams
The market is showing some interesting price action and looks like it's making an attempt to trade higher but, like everything in life, you have to consider the context surrounding certain events.
Position: N/A
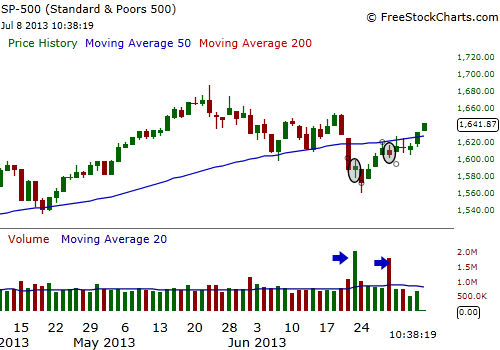
| The S&P 500 Index (SPX) has been on the decline since late May with weakness following into June. Recently, on June 21, 2013, and on June 28, 2013, there were key distribution days, but they had different characteristics that could have different results. On June 21, 2013, price action opened and closed at almost the same level, forming a bullish doji — a candlestick pattern that indicates there was an almost perfect balance between buyers & sellers on a price bar — but in this case, the bulls had a slight edge for the day. If you look at the volume for that trading day, volume was almost 2 1/2 times the 20-day daily average and appeared bullish, but price ended up almost where it started. Volume and price are like two sides of the same coin and have a unique relationship with one another. When price is rising, you can usually spot volume rising with it, and when price is falling, you can typically count on volume falling as well. However, when price and volume are not in sync, it means that something is changing in the market. |

|
| Figure 1. On June 21, 2013 and June 28, 2013, two doji candlestick patterns formed on heavy volume indicating that there was distribution underway by institutional traders. While the trend is up in the short-term, remain cautious and tighten up your stops just in case of a sudden market decline. |
| Graphic provided by: www.freestockcharts.com. |
| |
| In this case, you can determine that the major institutional traders and mutual funds were selling off positions and/or readjusting their portfolios. This could be for a couple of reasons. First, the Fed has begun to show their hand by raising interest rates on 30-year mortgages, which could have far-reaching effects in the economy, which I will detail in just a moment. But for now, this move by the Fed signals that the era of cheap money and credit may be over. While that may be a slight exaggeration, Wall Street tends to overreact to anything that changes the status quo, and changing rates, or even the fear of changing rates, causes traders, especially the big players, to panic. |

|
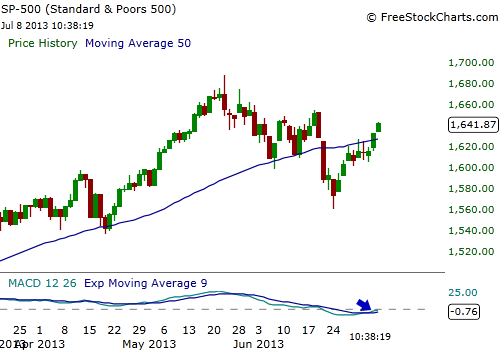
| Figure 2. The MACD just signaled a long signal in the SPX but because of a combination of distribution and the summer doldrums, it would be wise to wait until the market's signals are more clear as to whether this rally shows more conviction to the upside. |
| Graphic provided by: www.freestockcharts.com. |
| |
| A change of rates in the housing industry — the biggest segment of the economy — may result in a tsunami of anxiety sweeping up on the shores of Wall Street, since housing affects almost every other industry. Low rates make it possible for home buyers to purchase new homes, which keeps the home builders churning out homes. It also keeps real estate agents gainfully employed, keeps furniture manufacturers producing household items, and keeps the retail industry selling everything from new linen to toasters, not to mention the landscapers who service the lawns, and so on. An entire ecosystem is supported by this critical cornerstone of a massive economy. Anything that threatens the status quo — in this case, the ability to get cheap interest rates — puts the entire system in danger. At least in Wall Street's eyes, if big players are scared, they will react defensively. |
| Combine that with the seasonal summer pattern that is marked by weakness, and you have the underlying dynamics of a market left in doubt. |
Billy Williams has been trading the markets for 27 years, specializing in momentum trading with stocks and options.
| Company: | StockOptionSystem.com |
| E-mail address: | stockoptionsystem.com@gmail.com |
Traders' Resource Links | |
| StockOptionSystem.com has not added any product or service information to TRADERS' RESOURCE. | |
Click here for more information about our publications!
PRINT THIS ARTICLE

Request Information From Our Sponsors
- StockCharts.com, Inc.
- Candle Patterns
- Candlestick Charting Explained
- Intermarket Technical Analysis
- John Murphy on Chart Analysis
- John Murphy's Chart Pattern Recognition
- John Murphy's Market Message
- MurphyExplainsMarketAnalysis-Intermarket Analysis
- MurphyExplainsMarketAnalysis-Visual Analysis
- StockCharts.com
- Technical Analysis of the Financial Markets
- The Visual Investor
- VectorVest, Inc.
- Executive Premier Workshop
- One-Day Options Course
- OptionsPro
- Retirement Income Workshop
- Sure-Fire Trading Systems (VectorVest, Inc.)
- Trading as a Business Workshop
- VectorVest 7 EOD
- VectorVest 7 RealTime/IntraDay
- VectorVest AutoTester
- VectorVest Educational Services
- VectorVest OnLine
- VectorVest Options Analyzer
- VectorVest ProGraphics v6.0
- VectorVest ProTrader 7
- VectorVest RealTime Derby Tool
- VectorVest Simulator
- VectorVest Variator
- VectorVest Watchdog
