HOT TOPICS LIST
- MACD
- Fibonacci
- RSI
- Gann
- ADXR
- Stochastics
- Volume
- Triangles
- Futures
- Cycles
- Volatility
- ZIGZAG
- MESA
- Retracement
- Aroon
INDICATORS LIST
LIST OF TOPICS
PRINT THIS ARTICLE
by Koos van der Merwe
A Wave 5 top signals the end of a bull trend and can be followed by a nasty correction.
Position: Buy
Koos van der Merwe
Has been a technical analyst since 1969, and has worked as a futures and options trader with First Financial Futures in Johannesburg, South Africa.
PRINT THIS ARTICLE
ELLIOTT WAVE
That Cat In The Bag
07/11/13 03:53:42 PMby Koos van der Merwe
A Wave 5 top signals the end of a bull trend and can be followed by a nasty correction.
Position: Buy
| All Elliott wave followers know that the first rule of Elliott wave analysis is that the "chart must look right." By this, we mean that Wave 5 is equal to or greater than wave 1 and that wave 3 is greater than wave 1. Once a wave 5 is complete, the ABC correction that follows takes the price down to the 4th wave of lesser degree. Of course, there are variations. For example, if wave 3 is less than wave 1, then wave 5 must be less than wave 3, but this count, as well as other variations, occurs rarely. If it occurs too frequently, then either the wave count is incorrect or the count is in a period of uncertainty and a proper count will eventually appear. You should never forget that Elliott wave analysis is purely a signpost in the wilderness, and another signpost showing a change of direction can appear a little ways down the road. |

|
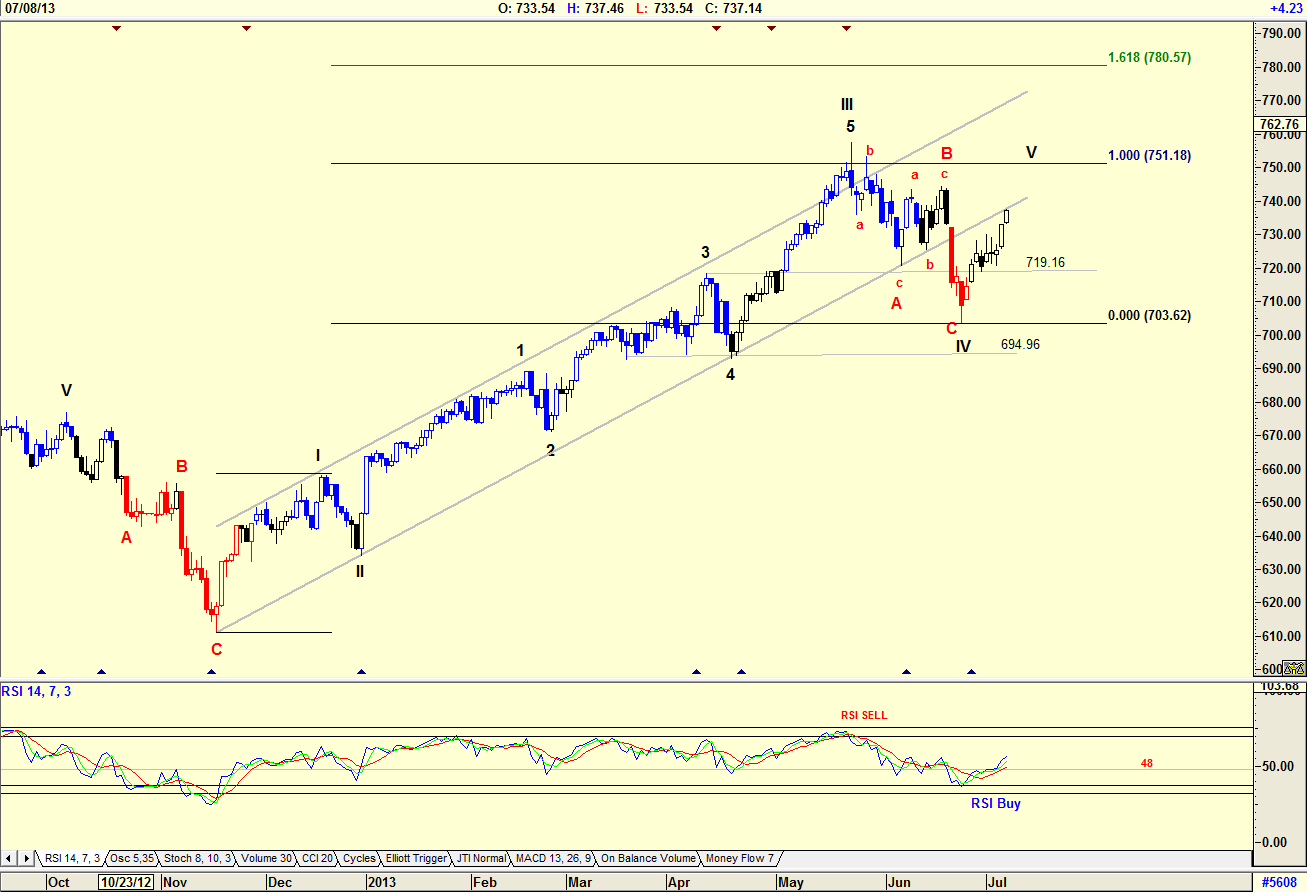
| Figure 1. Daily chart of the S&P100 Index |
| Graphic provided by: AdvancedGET. |
| |
| The Elliott wave count in the chart of the S&P 100 index in Figure 1 suggests that the index has completed a WAVE 4 and is now in a WAVE 5 bull trend. With the rule that the length of a wave 5 should equal the length of a wave 1, you can therefore expect WAVE 5 to top out at the 751.18 level. Do note that WAVE IV did turn within the 4th wave of lesser degree, between 694.96 and 719.16, showing that the chart obeyed the first rule of Elliott wave analysis. The rise to 751.18, therefore, looks very real. |

|
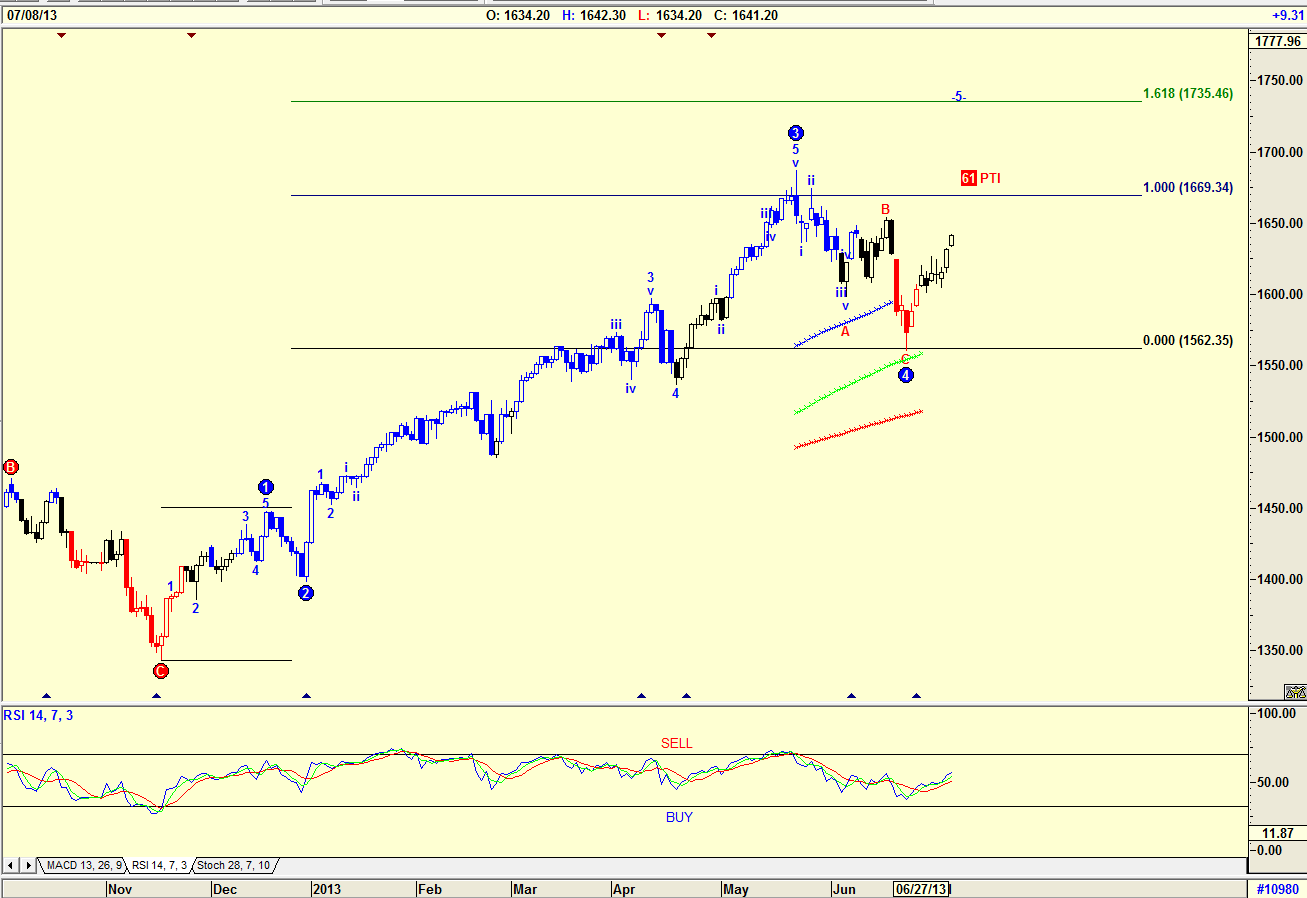
| Figure 2. Daily Chart of the S&P500 Index |
| Graphic provided by: AdvancedGET. |
| |
| The daily chart of the S&P 500 index in Figure 2 displays an Elliott wave count suggested by the Advanced GET program. Note that the Advanced GET program is also suggesting that a WAVE IV has been completed, but it is suggesting that WAVE V will rise to the 1.618 level of 1735.46 with a PTI (probability index) of 61%. This is something I would like to believe, as I am sure we all would, but I would be watching the chart carefully as the index approaches the 1669.34 level, where the length of Wave 5 is equal to the length of Wave I. Do realize that once WAVE V is complete, the share price will fall once again to the fourth wave of lesser degree, which could be in the region of 1562. |

|
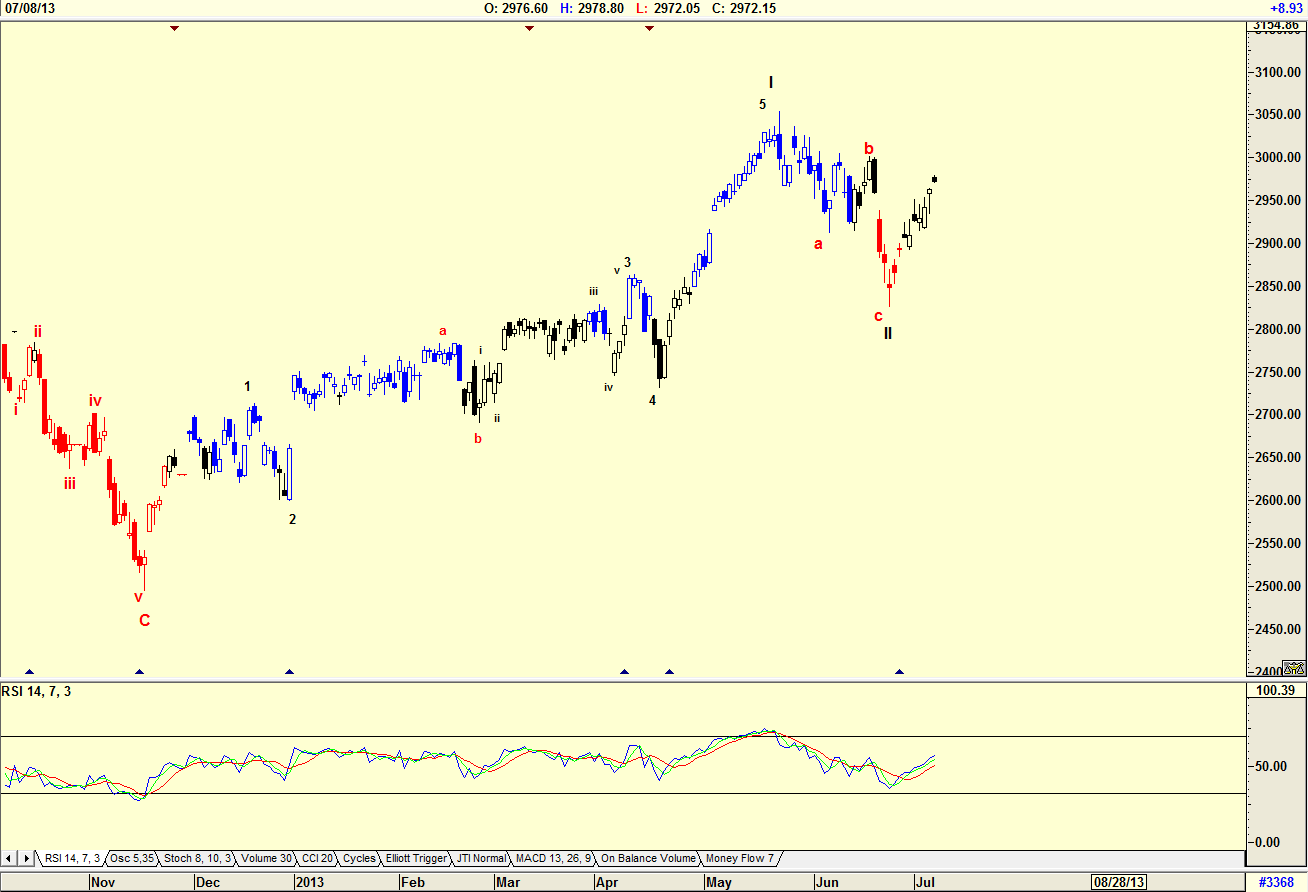
| Figure 3. Daily Chart of the Nasdaq 100 Index |
| Graphic provided by: AdvancedGET. |
| |
| The daily chart of the NASDAQ 100 in Figure 3 shows a difficult Elliott wave count, which is open to a possible corrected wave count as the NASDAQ index moves. At present though, we stick with the count shown because it ties in with the count of the S&P 100 and S&P 500 index with a WAVE C bottom in October 2012. However, where the S&P indexes are suggesting that they are in a WAVE 5, the NASDAQ is suggesting that it is only in a WAVE 3. Note the other abnormality, the ab correction in Wave 3, an abnormality that I have noticed is starting to occur in a Wave 3. This goes against the rule, "The Elliott wave count must look right," which means that I can change the count a little ways down the road. |

|
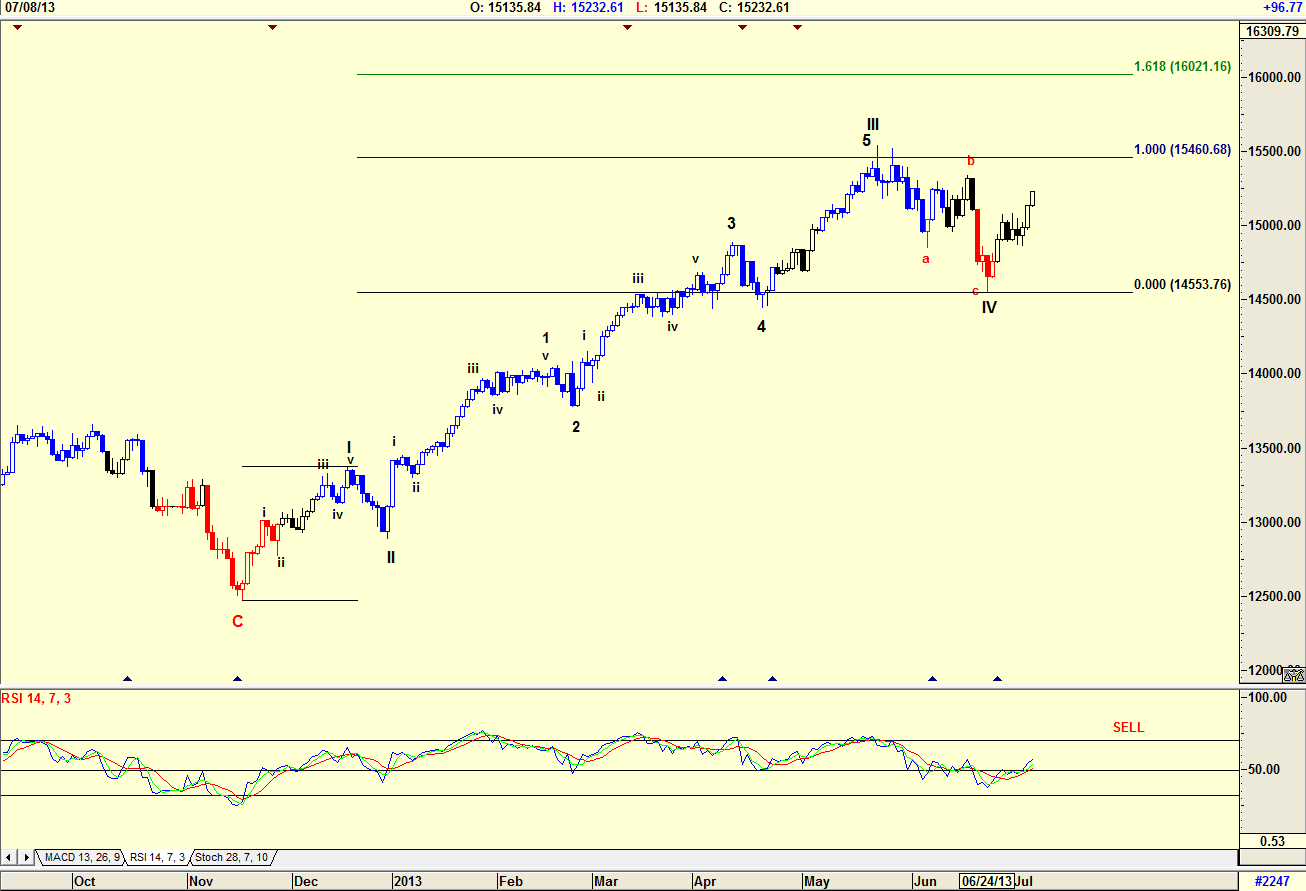
| Figure 4 Daily chart of the Dow Jones Index |
| Graphic provided by: AdvancedGET. |
| |
| The chart in Figure 4 is of the Dow Jones Industrial Average (DJIA). A wave count suggests a similar count to that of the S&P 100 and S&P 500 indexes shown in Figures 1 and 2. The Fibonacci extension suggests that should wave 5 equal wave 1, then the DJIA could rise to the 15460.68 level, with the outside possibility of a rise to 16021.16 level -- the 1.618% level of wave 1. Three of the charts above show that a major correction will occur sometime in the near future, with an Elliott wave count in a Wave 5. The only chart that suggests that the correction need not be a major one is the NASDAQ index, which suggests that when the correction does occur, it will be a wave 4. However, you should always remember that if Wave 2 is a simple wave, then Wave 4 will be a complicated wave. The NASDAQ chart shows Wave 2 as being a complicated wave. Wave 4 could then be a simple wave or an even more complicated wave. That a correction is going to occur in the near future is in the cards, a correction that could last into mid-October, if historical cycles behave themselves. The "cat in the bag" is computer trading, which is unemotional, and could be the reason why the NASDAQ index differs from the S&P and DJIA. |
Has been a technical analyst since 1969, and has worked as a futures and options trader with First Financial Futures in Johannesburg, South Africa.
| Address: | 3256 West 24th Ave |
| Vancouver, BC | |
| Phone # for sales: | 6042634214 |
| E-mail address: | petroosp@gmail.com |
Click here for more information about our publications!
Comments
Date: 07/14/13Rank: 5Comment:

Request Information From Our Sponsors
- StockCharts.com, Inc.
- Candle Patterns
- Candlestick Charting Explained
- Intermarket Technical Analysis
- John Murphy on Chart Analysis
- John Murphy's Chart Pattern Recognition
- John Murphy's Market Message
- MurphyExplainsMarketAnalysis-Intermarket Analysis
- MurphyExplainsMarketAnalysis-Visual Analysis
- StockCharts.com
- Technical Analysis of the Financial Markets
- The Visual Investor
- VectorVest, Inc.
- Executive Premier Workshop
- One-Day Options Course
- OptionsPro
- Retirement Income Workshop
- Sure-Fire Trading Systems (VectorVest, Inc.)
- Trading as a Business Workshop
- VectorVest 7 EOD
- VectorVest 7 RealTime/IntraDay
- VectorVest AutoTester
- VectorVest Educational Services
- VectorVest OnLine
- VectorVest Options Analyzer
- VectorVest ProGraphics v6.0
- VectorVest ProTrader 7
- VectorVest RealTime Derby Tool
- VectorVest Simulator
- VectorVest Variator
- VectorVest Watchdog
