HOT TOPICS LIST
- MACD
- Fibonacci
- RSI
- Gann
- ADXR
- Stochastics
- Volume
- Triangles
- Futures
- Cycles
- Volatility
- ZIGZAG
- MESA
- Retracement
- Aroon
INDICATORS LIST
LIST OF TOPICS
PRINT THIS ARTICLE
by Chaitali Mohile
The powerful bullish rally in CREE could have an attractive target.
Position: Hold
Chaitali Mohile
Active trader in the Indian stock markets since 2003 and a full-time writer. Trading is largely based upon technical analysis.
PRINT THIS ARTICLE
TECHNICAL ANALYSIS
CREE Inching Higher
07/10/13 04:54:44 PMby Chaitali Mohile
The powerful bullish rally in CREE could have an attractive target.
Position: Hold
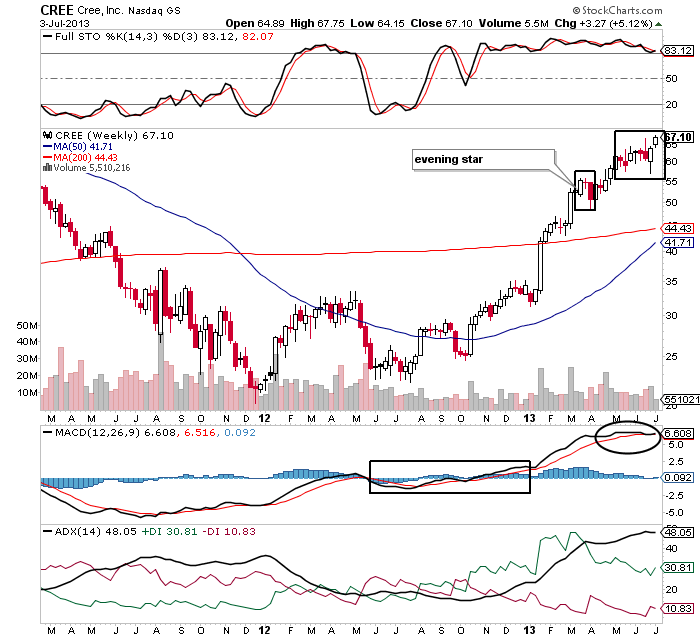
| Cree Inc. (CREE) has formed a large bowl on its weekly chart (Figure 1). The rounded bottom is a bullish formation, since price can break above its moving average resistance. In Figure 1, CREE broke above its 50-period and the 200-period moving average (MA) resistance since its price was around $44. The average directional index (ADX) (14) developed a new uptrend as CREE breached its 50-period MA resistance. Gradually, the buying pressure increased, pulling the bullish trend higher. The moving average convergence/divergence (MACD) (12,26,9) and full stochastic (14,3,3) also surged into bullish regions. |
| Thus, it is safe to assume that the rounded bottom formation has completed and the 200-period MA resistance has now become a support level. After the breakout, CREE gained 22 points and reached the 67 levels. The robust bullish force ignored an evening star candlestick pattern formed in the middle of the rally. CREE continued its bullish journey, inching higher. In the meantime, all three indicators turned extremely bullish. In Figure 1 you can see that the uptrend is overheated, the MACD (12,26,9) is positive, and the stochastic oscillator is highly overbought. All indicators are suggesting trend reversal possibilities, which could result in the slowdown of the bullish rally. |

|
| FIGURE 1: CREE, WEEKLY. |
| Graphic provided by: StockCharts.com. |
| |
| The trend reversal could be a minor consolidation period for CREE. Since the price rally is not indicating any bearish signs, the stock is likely to maintain its bullish levels. The black box in Figure 1 shows doji candlesticks and a few candles with upper and lower shadows, suggesting uncertainty in the rally. The stock would consolidate once the indicators began retracing from the overheated zones. The full stochastic and the ADX (14) can remain extremely bullish for a long while without harming the existing rally, and CREE would continue to surge for the next few trading session. |

|
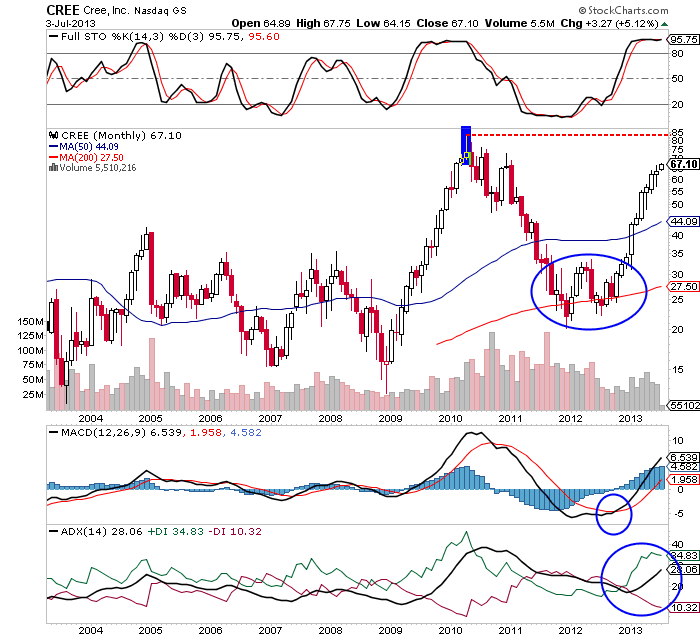
| FIGURE 2: CREE, MONTHLY. |
| Graphic provided by: StockCharts.com. |
| |
| CREE initiated a corrective rally in 2010 from $87. A shooting star candlestick pattern, the highly overbought stochastic, an extremely positive MACD (12,26,9), and the marginally overheated uptrend indicated an upcoming bearish price rally. The stock dropped from $87 to $20 and established support at the 200-period MA. The higher low formed at the MA support geared up a relief rally (Figure 2). A bullish 50-period MA breakout helped the stock regain bullish strength. Eventually, a new uptrend developed and the stochastic oscillator confirmed the buying opportunity by surging above the 20 levels (oversold region). |
| Although the stock has reached $67, it still has a ways to go to reach its previous high of $85. The uptrend is still developing, the positive MACD (12,26,9) has recently surged above the zero line, and the overbought stochastic is showing no signs of reversal. Hence, CREE is likely to continue its upward price action. Therefore, traders with long positions can consider holding their positions. New trading opportunities could present themselves once there is a pullback. |
Active trader in the Indian stock markets since 2003 and a full-time writer. Trading is largely based upon technical analysis.
| Company: | Independent |
| Address: | C1/3 Parth Indraprasth Towers. Vastrapur |
| Ahmedabad, Guj 380015 | |
| E-mail address: | chaitalimohile@yahoo.co.in |
Traders' Resource Links | |
| Independent has not added any product or service information to TRADERS' RESOURCE. | |
Click here for more information about our publications!
Comments

Request Information From Our Sponsors
- StockCharts.com, Inc.
- Candle Patterns
- Candlestick Charting Explained
- Intermarket Technical Analysis
- John Murphy on Chart Analysis
- John Murphy's Chart Pattern Recognition
- John Murphy's Market Message
- MurphyExplainsMarketAnalysis-Intermarket Analysis
- MurphyExplainsMarketAnalysis-Visual Analysis
- StockCharts.com
- Technical Analysis of the Financial Markets
- The Visual Investor
- VectorVest, Inc.
- Executive Premier Workshop
- One-Day Options Course
- OptionsPro
- Retirement Income Workshop
- Sure-Fire Trading Systems (VectorVest, Inc.)
- Trading as a Business Workshop
- VectorVest 7 EOD
- VectorVest 7 RealTime/IntraDay
- VectorVest AutoTester
- VectorVest Educational Services
- VectorVest OnLine
- VectorVest Options Analyzer
- VectorVest ProGraphics v6.0
- VectorVest ProTrader 7
- VectorVest RealTime Derby Tool
- VectorVest Simulator
- VectorVest Variator
- VectorVest Watchdog
