HOT TOPICS LIST
- MACD
- Fibonacci
- RSI
- Gann
- ADXR
- Stochastics
- Volume
- Triangles
- Futures
- Cycles
- Volatility
- ZIGZAG
- MESA
- Retracement
- Aroon
INDICATORS LIST
LIST OF TOPICS
PRINT THIS ARTICLE
by Koos van der Merwe
Mark Carney, the Governor of the Bank of England signalled that interest rates will be kept at a record low.
Position: Buy
Koos van der Merwe
Has been a technical analyst since 1969, and has worked as a futures and options trader with First Financial Futures in Johannesburg, South Africa.
PRINT THIS ARTICLE
RSI
Two English Banks
07/09/13 02:13:52 PMby Koos van der Merwe
Mark Carney, the Governor of the Bank of England signalled that interest rates will be kept at a record low.
Position: Buy
| Canadian Mark Carney started his new job as Governor of the Bank of England on Monday, July 1, 2013. On July 4, 2013 he signalled that the Bank of England will keep interest rates at a record low. This is longer than investors had expected. The British pound fell the most in almost five months against the US dollar, and U.K. stocks rallied the most in six months. Two banks that jumped more than 3% on the U.K. market are Royal Bank of Scotland and Barclays Bank. |

|
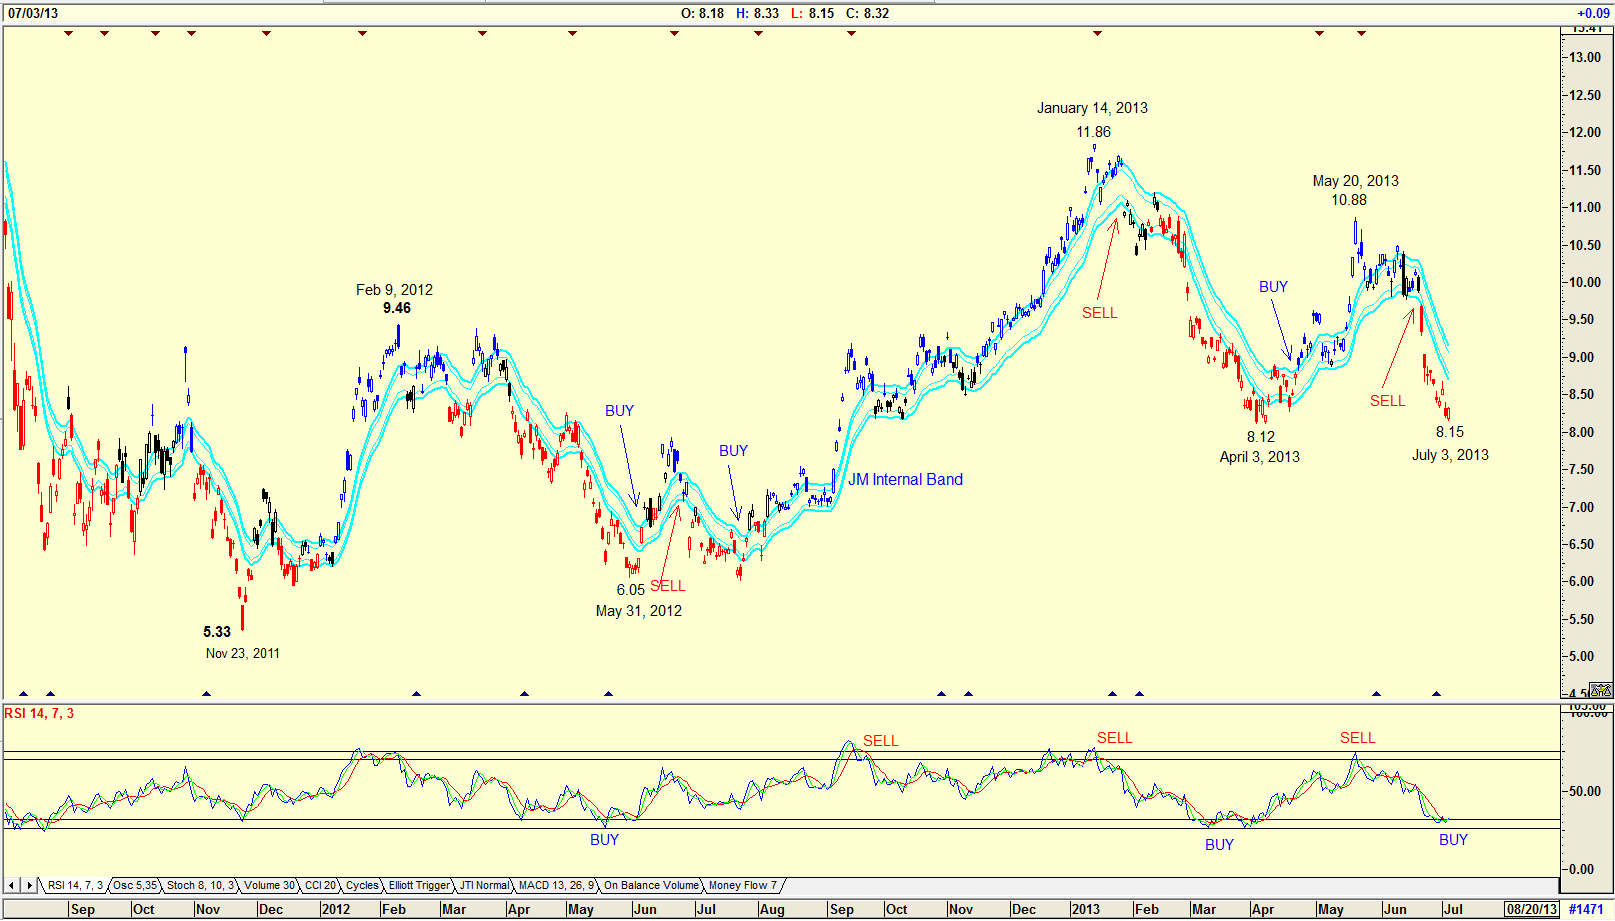
| Figure 1. Daily chart of Royal Bank of Scotland. |
| Graphic provided by: AdvancedGET. |
| |
| The chart in Figure 1 is a daily chart of Royal Bank of Scotland (RBS) as listed on the New York Stock Exchange. The chart shows how the price bottomed on November 23, 2011 at $5.33. The price then rose to $9.46 by February 9, 2012 before falling to $6.05 by May 31, 2013. With the RSI indicator suggesting a buy signal, the price rose to $11.86 by January 14, 2013. From the high it fell on an RSI sell signal to a low of $8.12 by April 3, 2013. With an RSI buy signal it rose to $10.88 by May 20, 2013 and then promptly fell on an RSI sell signal to $8.15 by July 3, 2013. The RSI indicator is presently oversold and suggesting a buy. More conservative investors could wait for a buy signal to be triggered when the price breaks above the upper band of the JM Internal Band indicator. The JM Internal band indicator is a simple 15-period moving average offset by 2% positive and 2% negative. A move above the upper band suggests a buy signal, and a move below the lower band, a sell signal. Finally do note the change in color of the candlesticks. Blue candlesticks are a positive, black is neutral and red is negative. The change in color could suggest a confirmation. |

|
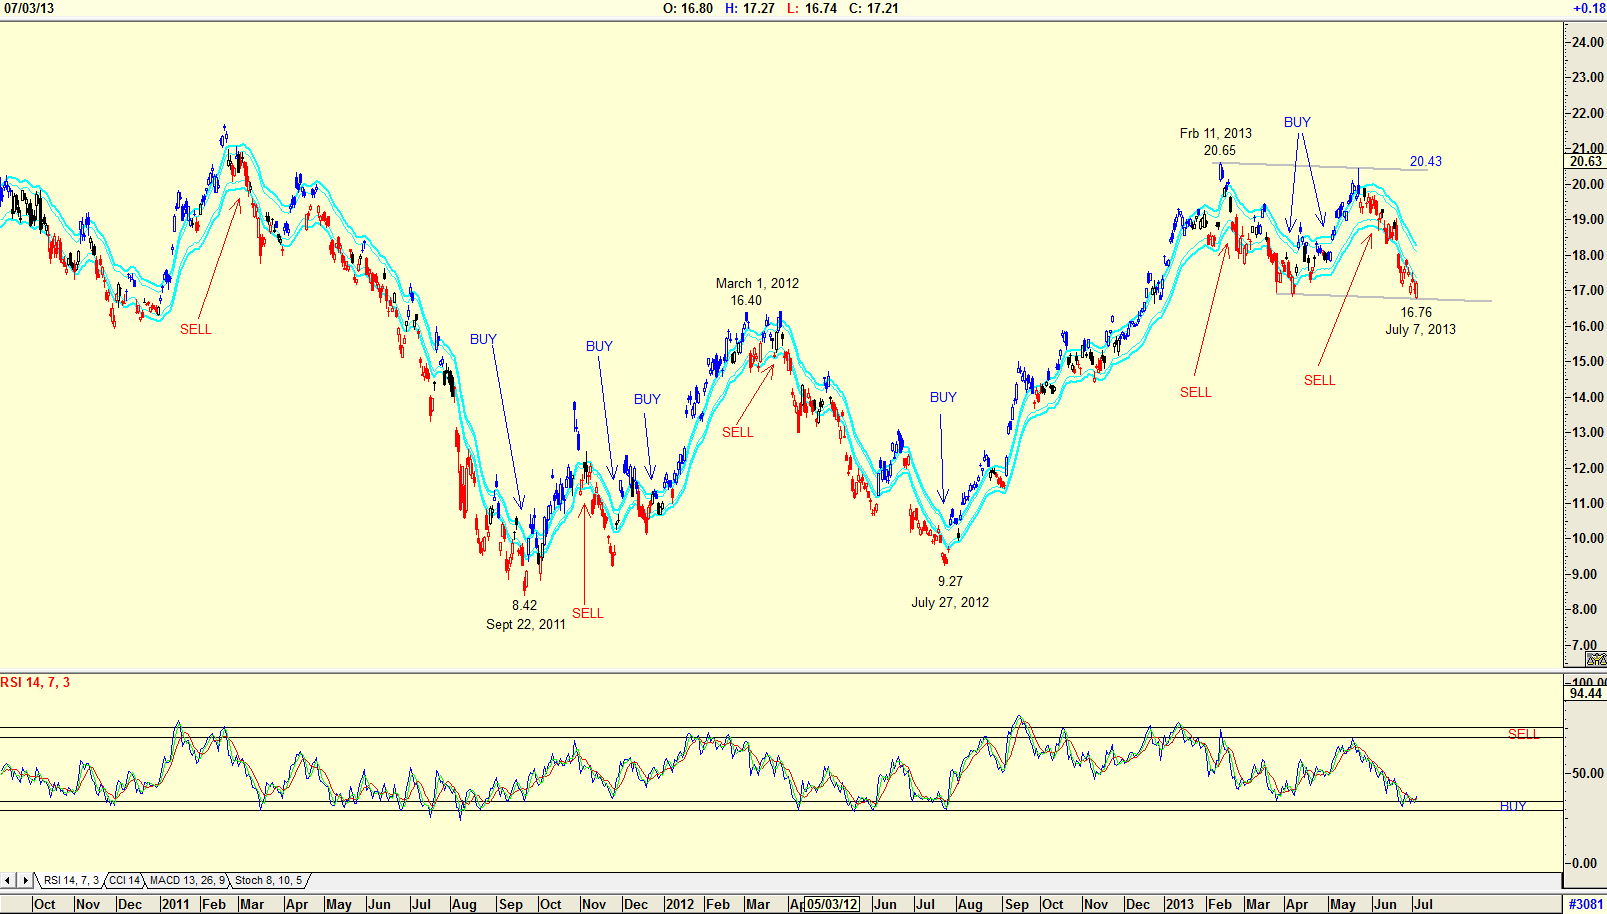
| Figure 2. Daily chart of Barclays Bank. |
| Graphic provided by: AdvancedGET. |
| |
| The chart in Figure 2 is a daily chart of Barclays Bank ADR (BCS) showing the RSI and JM Internal Band buy and sell signals. The chart is showing that the price at $16.76 is bouncing off a support line in a rectangle formation. The RSI indicator is suggesting a buy signal. The rectangle formation is suggesting a target of $32.03 should the price break above the upper band at $20.43 (20.65-9.27=11.38+20.65=32.03). Once again conservative investors could wait for a move above the upper JM Internal band, or a change in the color of the candlestick from red to black to blue. With the change in Governorship of the Bank of England, and one must remember that it was Mark Carney who as Governor of the Bank of Canada kept the Canadian economy from collapsing along with the rest of the world, I would seriously think of buying both these banks. |
Has been a technical analyst since 1969, and has worked as a futures and options trader with First Financial Futures in Johannesburg, South Africa.
| Address: | 3256 West 24th Ave |
| Vancouver, BC | |
| Phone # for sales: | 6042634214 |
| E-mail address: | petroosp@gmail.com |
Click here for more information about our publications!
PRINT THIS ARTICLE

Request Information From Our Sponsors
- VectorVest, Inc.
- Executive Premier Workshop
- One-Day Options Course
- OptionsPro
- Retirement Income Workshop
- Sure-Fire Trading Systems (VectorVest, Inc.)
- Trading as a Business Workshop
- VectorVest 7 EOD
- VectorVest 7 RealTime/IntraDay
- VectorVest AutoTester
- VectorVest Educational Services
- VectorVest OnLine
- VectorVest Options Analyzer
- VectorVest ProGraphics v6.0
- VectorVest ProTrader 7
- VectorVest RealTime Derby Tool
- VectorVest Simulator
- VectorVest Variator
- VectorVest Watchdog
- StockCharts.com, Inc.
- Candle Patterns
- Candlestick Charting Explained
- Intermarket Technical Analysis
- John Murphy on Chart Analysis
- John Murphy's Chart Pattern Recognition
- John Murphy's Market Message
- MurphyExplainsMarketAnalysis-Intermarket Analysis
- MurphyExplainsMarketAnalysis-Visual Analysis
- StockCharts.com
- Technical Analysis of the Financial Markets
- The Visual Investor
