

HOT TOPICS LIST
- MACD
- Fibonacci
- RSI
- Gann
- ADXR
- Stochastics
- Volume
- Triangles
- Futures
- Cycles
- Volatility
- ZIGZAG
- MESA
- Retracement
- Aroon
INDICATORS LIST
LIST OF TOPICS
PRINT THIS ARTICLE
by Billy Williams
If June made your stomach churn with all the up and down trading, then you might get some relief in July if you understand a few key traits for this summer month.
Position: N/A
Billy Williams
Billy Williams has been trading the markets for 27 years, specializing in momentum trading with stocks and options.
PRINT THIS ARTICLE
TECHNICAL ANALYSIS
July Bounce In The Making
07/08/13 12:35:59 PMby Billy Williams
If June made your stomach churn with all the up and down trading, then you might get some relief in July if you understand a few key traits for this summer month.
Position: N/A
| July is typically the strongest quarter of the third quarter since the secnd quarter ends by more retirement funds being poured into the stock market. With a large amount of investment capital pouring into the market, it led to a spike in volume along with a jump in price as the market absorbs new capital. Seasonally, in a post-election year, you can see that July sees its strongest points at its beginning and ending while remaining a little soft in the middle. This means that around the middle of the month, you should see some stagnant to back-and-forth buying and selling which could cause many traders to think that a repeat of June is taking place. If the pattern holds true, however, you'll see the end of July firm up and rally, but there is the question of if it will be sustained which is doubtful. So, if you do trade the bounce or end-of-month rally then adjust your profit targets as well as your stops just to be on the safe side. |
|
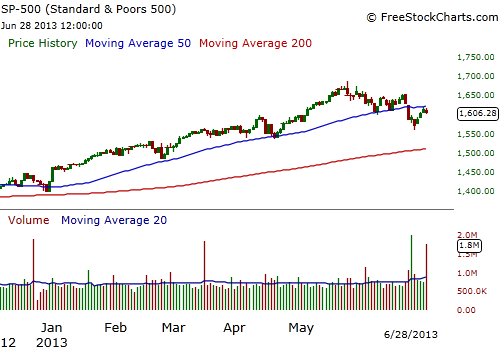
| The market is still in an uptrend even though it has declined in June which was expected according to seasonal price pattern performance. |
| Graphic provided by: www.freestockcharts.com. |
| |
| Also, keep in mind that if July rallies, again, from a statistical standpoint, it sets the stage for a better buying opportunity in the next four months. If you took positions near the beginning of the year and your stops haven't been hit, then it might be a good idea to sit tight. Even with the decline in June, the SPX is only down 30 points or so, and price is holding steady, which reveals there is some strength in the market and a rally could ensue as the end of 2013 approaches. That said, preparation is key for any rally that could develop and that means to find stocks that are holding up well during declines and showing a strong degree of relative strength within the strongest performing sectors. Like water, strength flows from industry-to-industry, sector-to-sector. To achieve the greatest amount of profit potential, you need to look for areas in the market that are gathering strength and beginning their bull runs. |
|
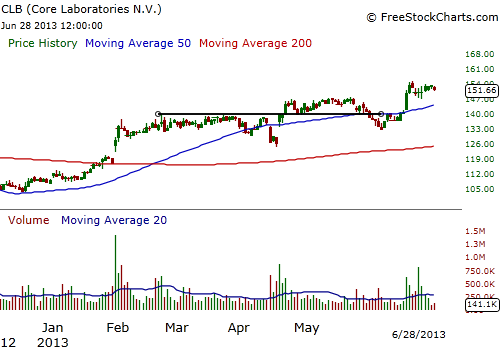
| CLB has a been a strong performing stock in the oil services industry. The 50 SMA and 200 SMA are in the right order and CLB's price has been in a base pattern for several months but now is not the time to take new positions at this time until strength returns to the overall market. |
| Graphic provided by: www.freestockcharts.com. |
| |
| There are a couple of ways to do that, the first being to spot stocks that are building up their first stage pattern and one of the ways you can do that is to use the 50-day SMA and the 200-day SMA along with some chart pattern recognition. When the SMA's are flatlined, meaning that there is no discernible trend and they are lined up left to right, almost on top of each other, and price is stagnant between two price points, you have an indication that some sort of first stage base pattern is formed. That type of stock needs to be investigated by taking a hard look at both its fundamental performance as well as its position within its marketplace. |
|
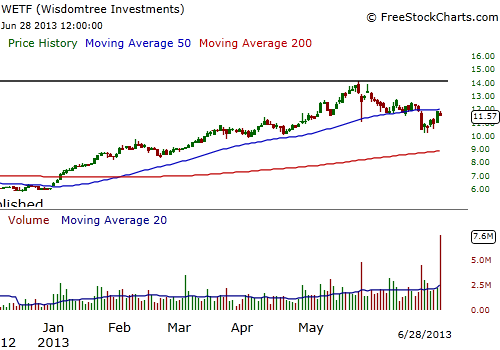
| Wisdom Tree Financials is a stock that recently emerged out of a long-term First Stage Pattern and, despite current weakness, is exhibiting some strenght and has the potential to soar higher on a bull run but, again, now is not the time with weakness in the overall market. However, you shouldn't worry about missing out on a good trade because high performing stocks will present new entry opportunities as long as you remain alert once everything aligns in the market. |
| Graphic provided by: www.freestockcharts.com. |
| |
| If its fundamental criteria is compelling then you want to track that stock if it does a couple of things. First, if price breaks out of that base pattern on higher volume along with the SMAs following - the 50 SMA above the 200 SMA - then you may have a stock beginning its bull run and you can catch the move on a pullback and/or trading back up through a new pivot point. Now is the time to prepare and do your homework so that when opportunities come available, you're ready and confident. |
Billy Williams has been trading the markets for 27 years, specializing in momentum trading with stocks and options.
| Company: | StockOptionSystem.com |
| E-mail address: | stockoptionsystem.com@gmail.com |
Traders' Resource Links | |
| StockOptionSystem.com has not added any product or service information to TRADERS' RESOURCE. | |
Click here for more information about our publications!
Comments

Request Information From Our Sponsors
- StockCharts.com, Inc.
- Candle Patterns
- Candlestick Charting Explained
- Intermarket Technical Analysis
- John Murphy on Chart Analysis
- John Murphy's Chart Pattern Recognition
- John Murphy's Market Message
- MurphyExplainsMarketAnalysis-Intermarket Analysis
- MurphyExplainsMarketAnalysis-Visual Analysis
- StockCharts.com
- Technical Analysis of the Financial Markets
- The Visual Investor
- VectorVest, Inc.
- Executive Premier Workshop
- One-Day Options Course
- OptionsPro
- Retirement Income Workshop
- Sure-Fire Trading Systems (VectorVest, Inc.)
- Trading as a Business Workshop
- VectorVest 7 EOD
- VectorVest 7 RealTime/IntraDay
- VectorVest AutoTester
- VectorVest Educational Services
- VectorVest OnLine
- VectorVest Options Analyzer
- VectorVest ProGraphics v6.0
- VectorVest ProTrader 7
- VectorVest RealTime Derby Tool
- VectorVest Simulator
- VectorVest Variator
- VectorVest Watchdog