HOT TOPICS LIST
- MACD
- Fibonacci
- RSI
- Gann
- ADXR
- Stochastics
- Volume
- Triangles
- Futures
- Cycles
- Volatility
- ZIGZAG
- MESA
- Retracement
- Aroon
INDICATORS LIST
LIST OF TOPICS
PRINT THIS ARTICLE
by Koos van der Merwe
Canadian banks were kept small and in good health by Mark Carney, the new Governor of the Bank of England.
Position: Buy
Koos van der Merwe
Has been a technical analyst since 1969, and has worked as a futures and options trader with First Financial Futures in Johannesburg, South Africa.
PRINT THIS ARTICLE
HEAD & SHOULDERS
Royal Bank Of Canada.
07/03/13 09:58:08 AMby Koos van der Merwe
Canadian banks were kept small and in good health by Mark Carney, the new Governor of the Bank of England.
Position: Buy
| Mark Carney has been credited with shielding Canada from the effects of the mortgage backed financial crises that caused the collapse of many banks throughout the world. He is regarded as the top figure in the financial world. On July 1st, he took up his appointment as Governor of the Bank of England. Canadian banks have benefited from his guidance, yet charts still shows how their share price fell along with the market. |

|
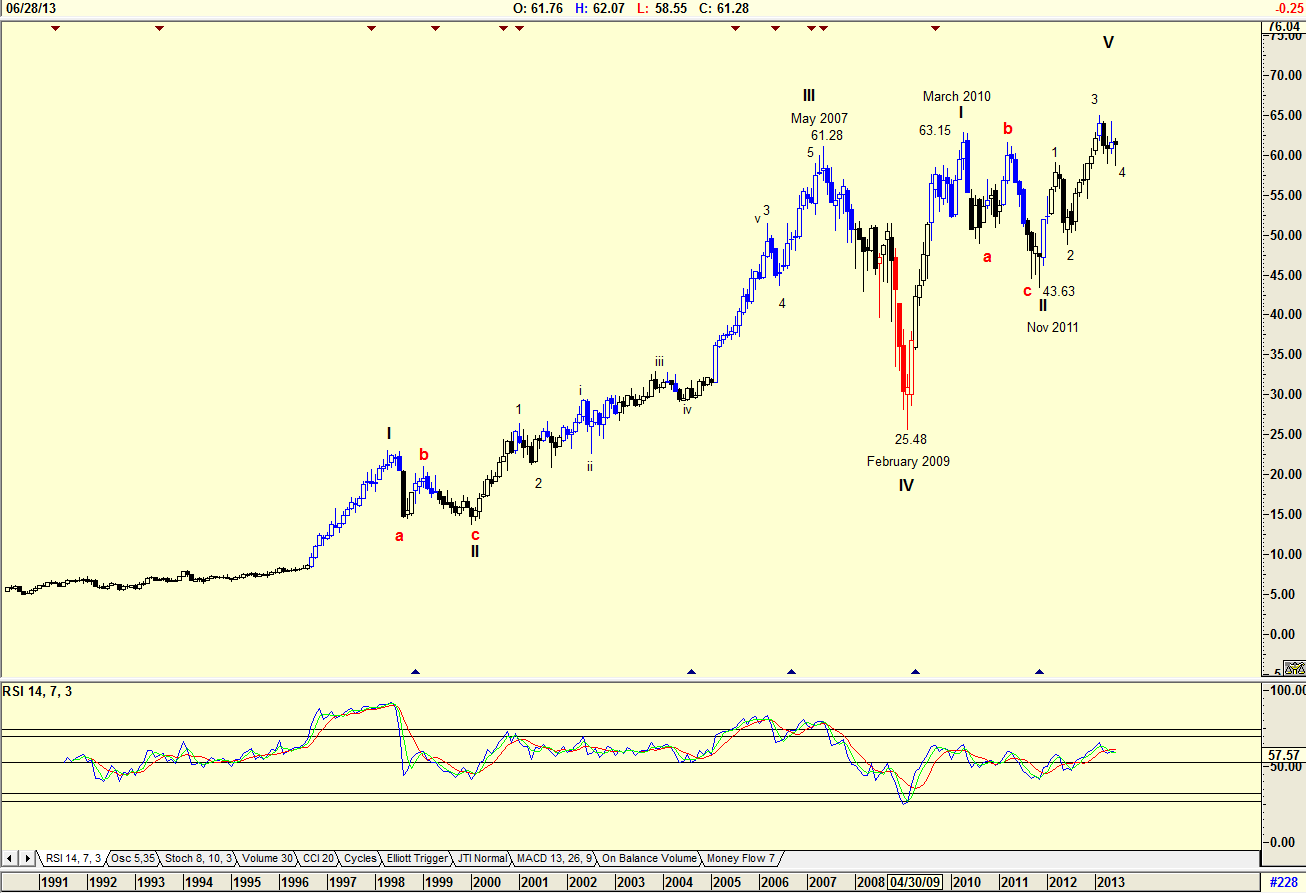
| Figure 1. Monthly Chart |
| Graphic provided by: AdvancedGET. |
| |
| The monthly chart in Figure 1 of Royal Bank of Canada (RY-T) shows how the price dropped in a Wave IV correction on May 2007 from a share price of $61.28 to $25.48 along with the drop in banks throughout the world, a drop of 58.41%. The price then recovered the loss in the year that followed rising to a high of $63.15 by March 2010. This rise is a WAVE 1 in a new bull trend. The price then fell in a Wave II to $43.63 by November 2011. From that low the price has risen and closed at $61.28 at end of June, the same price it reached in May 2007. |

|
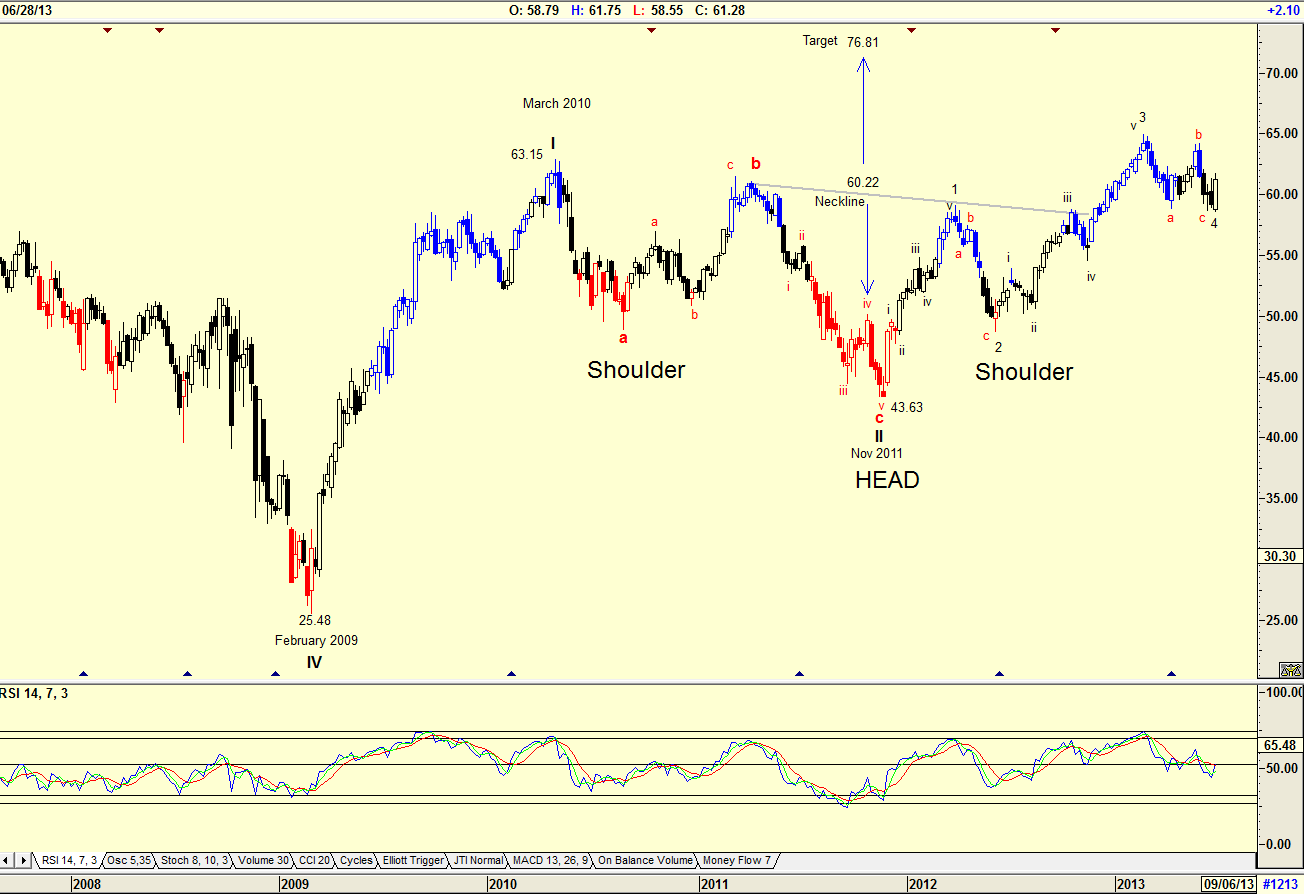
| Figure 2. Weekly Chart |
| Graphic provided by: AdvancedGET. |
| |
| The weekly chart in Figure 2 shows an inverse head & shoulder formation suggesting a target of $76.81 (60.22-43.63=16.59+60.22=76.81). The share price has broken through the neckline and is now tracing a wave 4 of a bull trend to the target of $76.81. The RSI indicator is testing the 50 level after being overbought, and history has shown that it could start rising in a new buy signal. |

|
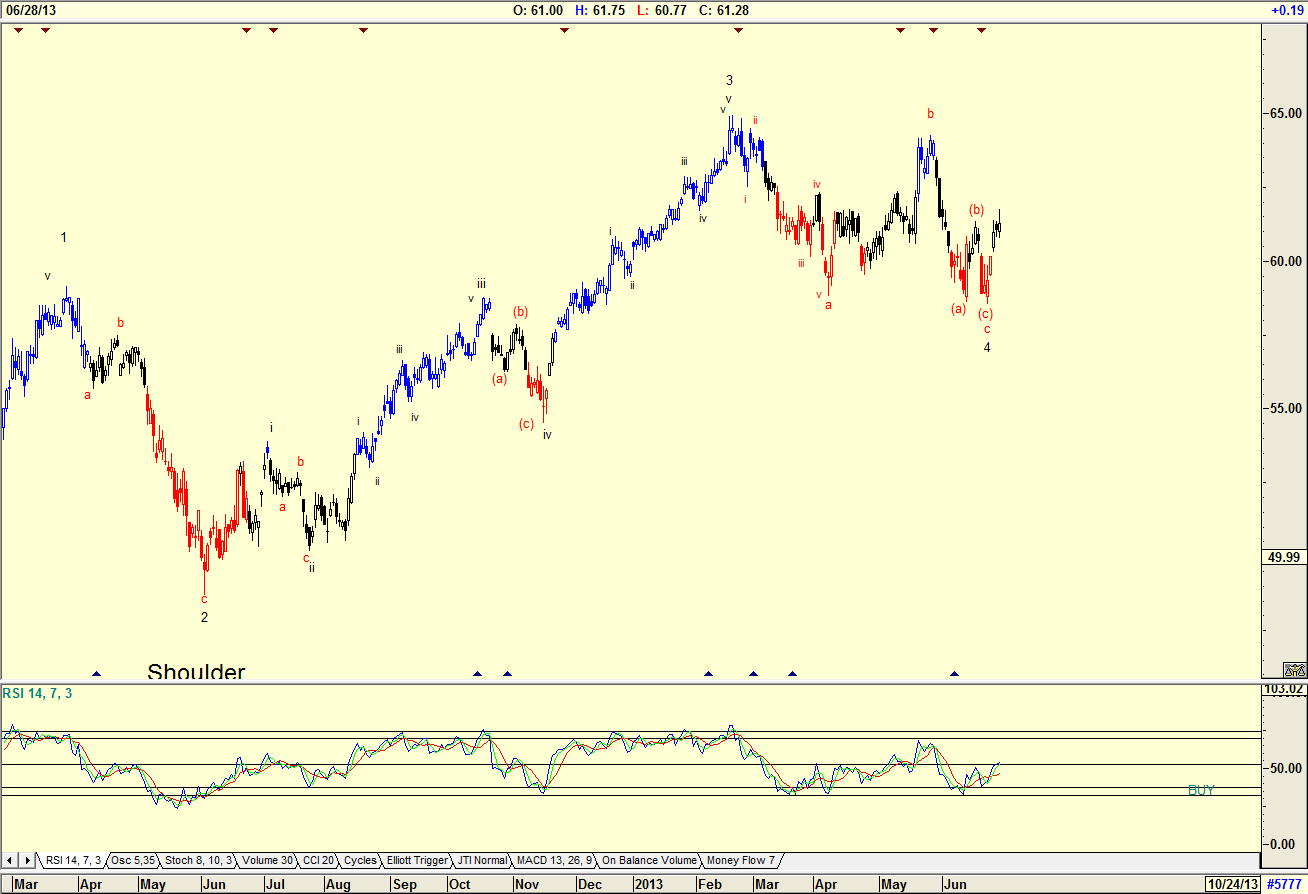
| Figure 3. Daily Chart |
| Graphic provided by: AdvancedGET. |
| |
| The daily chart in Figure 3 shows an RSI indicator suggesting a buy signal. The chances therefore of the price rising to $76.81 looks very promising. I would be a buyer of Royal Bank of Canada at this level. |
Has been a technical analyst since 1969, and has worked as a futures and options trader with First Financial Futures in Johannesburg, South Africa.
| Address: | 3256 West 24th Ave |
| Vancouver, BC | |
| Phone # for sales: | 6042634214 |
| E-mail address: | petroosp@gmail.com |
Click here for more information about our publications!
Comments

Request Information From Our Sponsors
- StockCharts.com, Inc.
- Candle Patterns
- Candlestick Charting Explained
- Intermarket Technical Analysis
- John Murphy on Chart Analysis
- John Murphy's Chart Pattern Recognition
- John Murphy's Market Message
- MurphyExplainsMarketAnalysis-Intermarket Analysis
- MurphyExplainsMarketAnalysis-Visual Analysis
- StockCharts.com
- Technical Analysis of the Financial Markets
- The Visual Investor
- VectorVest, Inc.
- Executive Premier Workshop
- One-Day Options Course
- OptionsPro
- Retirement Income Workshop
- Sure-Fire Trading Systems (VectorVest, Inc.)
- Trading as a Business Workshop
- VectorVest 7 EOD
- VectorVest 7 RealTime/IntraDay
- VectorVest AutoTester
- VectorVest Educational Services
- VectorVest OnLine
- VectorVest Options Analyzer
- VectorVest ProGraphics v6.0
- VectorVest ProTrader 7
- VectorVest RealTime Derby Tool
- VectorVest Simulator
- VectorVest Variator
- VectorVest Watchdog
