HOT TOPICS LIST
- MACD
- Fibonacci
- RSI
- Gann
- ADXR
- Stochastics
- Volume
- Triangles
- Futures
- Cycles
- Volatility
- ZIGZAG
- MESA
- Retracement
- Aroon
INDICATORS LIST
LIST OF TOPICS
PRINT THIS ARTICLE
by Billy Williams
There is a lot of fear in the market, and it's probably even worse than you might think.
Position: Sell
Billy Williams
Billy Williams has been trading the markets for 27 years, specializing in momentum trading with stocks and options.
PRINT THIS ARTICLE
TECHNICAL ANALYSIS
Fear And Strategy
07/01/13 03:26:48 PMby Billy Williams
There is a lot of fear in the market, and it's probably even worse than you might think.
Position: Sell
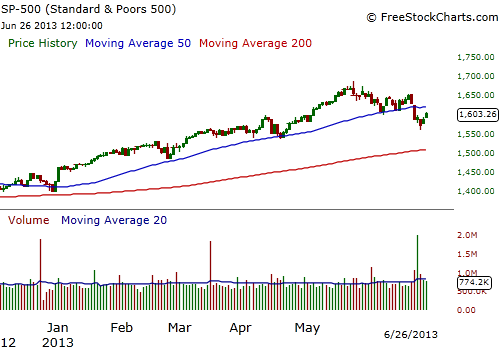
| The month of June started with May's weakness and though it tried to hang on, it now seems to be breaking down. The "summer doldrums", the seasonal trading pattern for the summer season, is usually marked by weakness and gradually goes from bad to worse as the dog days of summer roll on. So far, that seems to be the case and traders should be cautious about taking any direction except down for several reasons. For one, price traded below the June 6, 2013, low which reveals that the bears have control and are trying to force price down to lower levels. Next, no one could have forecasted that Fed Chief Ben Bernanke would show his hand when it comes to raising interest rates earlier this month. The bulls have been trading the market higher at a breathtaking pace since the beginning of the year with the stock market buoyed by cheap money and low interest rates. Companies like Google, Inc. and others, have been raising money through bond issues, even though they have had no acquisitions or expansions planned, but simply because funds have never been cheaper and have followed through simply to build up their war chest should opportunities present themselves. |

|
| Figure 1. Big investors are reshuffling their portfolios to adjust for rising interest rates with the market being further impacted by the summer seasonal pattern where the market traditionally stagnates and/or declines. The SPX has already sliced downward through its 50-day SMA and traded below the previous price low. |
| Graphic provided by: www.freestockcharts.com. |
| |
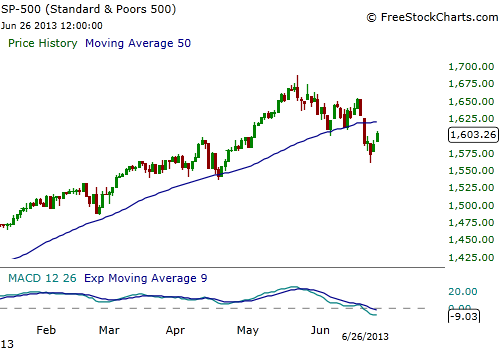
| Also, technical indicators, like the MACD, reveal that a top seems to have set in on major indexes like the S&P 500 (SPX) and price appears to be set to trend lower. After taking in all the technical and fundamental criteria, the market appears to be recalibrating and taking into account future projections that don't include cheap rates and, possibly, a slowdown of money printing. In the short-term, the SPX and other indexes, appear to be oversold and due for a bounce. The VIX (volatility index) has at its highest level since the beginning of 2013, coupled with the SPX forming a narrow Doji candlestick which could serve as a new entry point just over its intraday high. If price can trade higher than that intraday high, the bulls could regain control over the SPX's price movement and the upward trend could resume. |

|
| Figure 2. The MACD, a lagging indicator, has confirmed a downward trend in the SPX. This reading, along with other factors, indicates there is more downside to come in the market. |
| Graphic provided by: www.freestockcharts.com. |
| |
| In the meantime, stocks that are resisting the bears downward move need to be noted and added to your buy list. Stocks with high relative strength (RS) along with other compelling technical and fundamental criteria should be where your focus needs to stay concentrated during the summer. Though anything can happen, it is likely that the summer months will act as the staging ground where stocks will begin to form new base patterns that serve as a springboard to rally into the end of the year. For now, patience is your biggest weapon in order to allow opportunities to take form and be acted upon. |
Billy Williams has been trading the markets for 27 years, specializing in momentum trading with stocks and options.
| Company: | StockOptionSystem.com |
| E-mail address: | stockoptionsystem.com@gmail.com |
Traders' Resource Links | |
| StockOptionSystem.com has not added any product or service information to TRADERS' RESOURCE. | |
Click here for more information about our publications!
PRINT THIS ARTICLE

Request Information From Our Sponsors
- StockCharts.com, Inc.
- Candle Patterns
- Candlestick Charting Explained
- Intermarket Technical Analysis
- John Murphy on Chart Analysis
- John Murphy's Chart Pattern Recognition
- John Murphy's Market Message
- MurphyExplainsMarketAnalysis-Intermarket Analysis
- MurphyExplainsMarketAnalysis-Visual Analysis
- StockCharts.com
- Technical Analysis of the Financial Markets
- The Visual Investor
- VectorVest, Inc.
- Executive Premier Workshop
- One-Day Options Course
- OptionsPro
- Retirement Income Workshop
- Sure-Fire Trading Systems (VectorVest, Inc.)
- Trading as a Business Workshop
- VectorVest 7 EOD
- VectorVest 7 RealTime/IntraDay
- VectorVest AutoTester
- VectorVest Educational Services
- VectorVest OnLine
- VectorVest Options Analyzer
- VectorVest ProGraphics v6.0
- VectorVest ProTrader 7
- VectorVest RealTime Derby Tool
- VectorVest Simulator
- VectorVest Variator
- VectorVest Watchdog
