

HOT TOPICS LIST
- MACD
- Fibonacci
- RSI
- Gann
- ADXR
- Stochastics
- Volume
- Triangles
- Futures
- Cycles
- Volatility
- ZIGZAG
- MESA
- Retracement
- Aroon
INDICATORS LIST
LIST OF TOPICS
PRINT THIS ARTICLE
by Matt Blackman
Stocks (and bonds) have been the biggest beneficiaries of Quantitative Easing efforts but lately, stocks have been struggling. So what's next?
Position: N/A
Matt Blackman
Matt Blackman is a full-time technical and financial writer and trader. He produces corporate and financial newsletters, and assists clients in getting published in the mainstream media. He is the host of TradeSystemGuru.com. Matt has earned the Chartered Market Technician (CMT) designation. Find out what stocks and futures Matt is watching on Twitter at www.twitter.com/RatioTrade
PRINT THIS ARTICLE
BULL/BEAR MARKET
Intermarket Wrap - What Are Other Markets And Asset Classes Telling Us?
07/01/13 04:00:57 PMby Matt Blackman
Stocks (and bonds) have been the biggest beneficiaries of Quantitative Easing efforts but lately, stocks have been struggling. So what's next?
Position: N/A
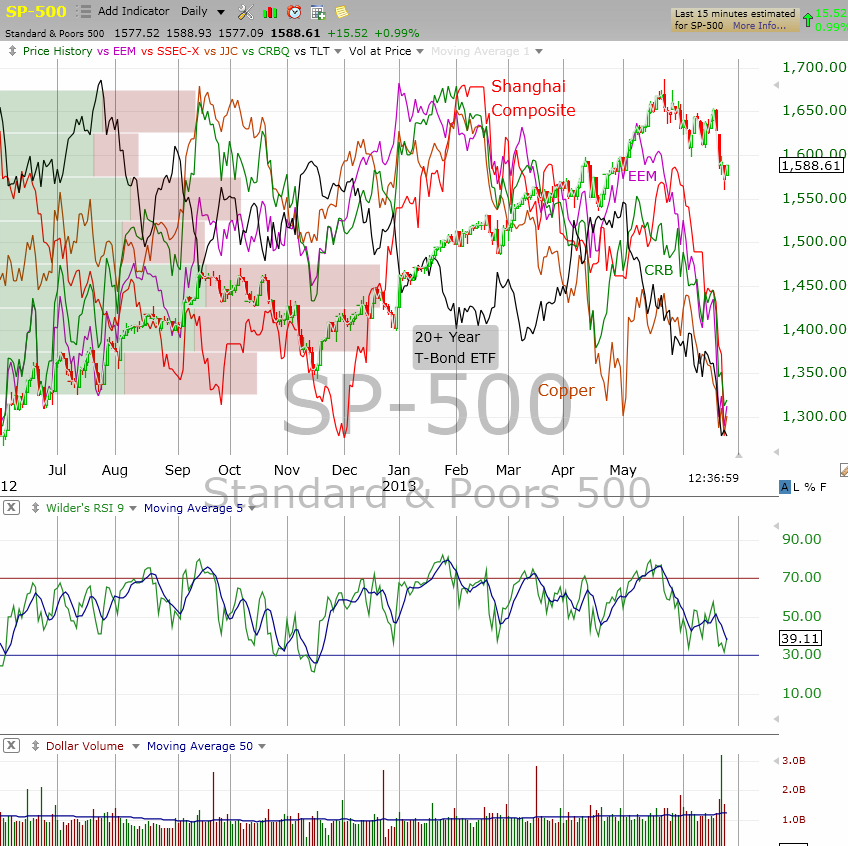
| As H1-2013 wound to a close, the S&P500 was still up double digits for the year even after the June correction. But as Figure 1 shows, other markets and asset classes hadn't fared as well. After having put in peaks in January/February, emerging markets and commodities struggled into mid-year. And after enjoying a brief run until May, 20+ year bonds joined this downtrend. |
|
| Figure 1 � Daily chart comparing the S&P500 (SP-500), iShares Emerging Market Fund ETF (EEM), the Shanghai Composite (SSEC-X), the new Thomson-Reuters Commodity Research Bureau (CRBQ), the iPath Copper Total Return ETF (JJC) and the iShares 20+ Year T-Bonds ETF (TLT). |
| Graphic provided by: TC2000.com. |
| |
| From an intermarket perspective, this action demonstrates the impact of multiple forces, much like choppy conditions at sea that indicate multiple wave influences. According to intermarket theory, bonds are the first to head higher in a rally, followed by stocks, then commodities. When stocks are challenged, investors head for the safety of bonds and when an economy begins to recover, the demand for money to grow the economy pushes bond prices up. Then when stocks begin to move higher on expectations for increased corporate profits, there is rising demand for commodities for raw materials used by manufacturers and prices rise. Copper is an excellent global indicator of manufacturing and building demand and it has dropped significantly since February 2013. But as we see in Figure 1, stock prices rose independently of the other markets until the last week in May. So what does this mixed asset picture mean for stocks going forward? |
|
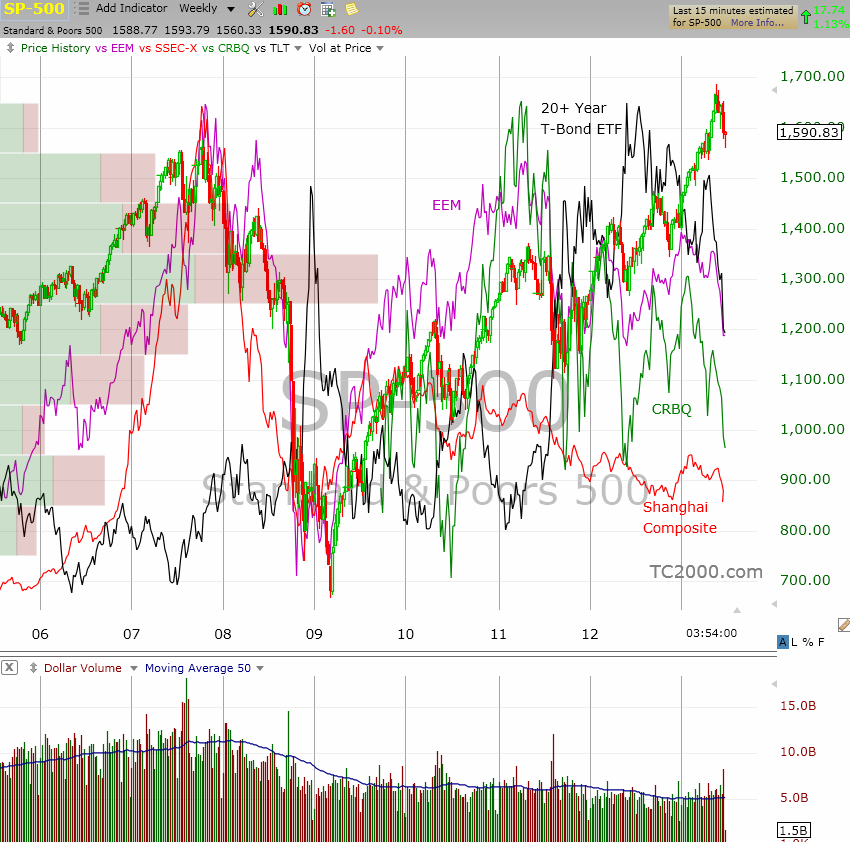
| Figure 2 � Weekly look at the S&P500, Emerging Markets ETF, Shanghai Composite, the Commodity Research Bureau and the iShares 20+ Year T-Bonds ETF. Not shown is the relationship between commodities and stocks, the first of which peaked in June 2008, eight months after the peak in stocks. |
| Graphic provided by: TC2000.com. |
| |
| Bond investors are clearly betting that interest rates (yields) will rise, which is initially positive for stocks. But commodity prices are telling us that traditional commercial buyers and futures traders are expecting lower inflationary pressure as evidenced by falling metal and materials prices and this will be bad for stocks longer term. Stocks corrected on comments by Chairman Bernanke in June 2013 when he opened the door to the possibility of an end to QE. And in a logical pre-QE investment world, stocks should continue to follow bond (and commodity) prices lower. As we see in Figure 2, at the last peak in October 2007, the SPX and emerging markets peaked around the same time. Commodities peaked nine months later in June 2008. Bonds then peaked in late 2008 only after the Fed had announced its Zero Interest Rate Program (ZIRP) that included such programs as the Troubled Asset Relief Program (TARP) which was designed to flood the market with liquidity to kick start the economy. Figure 2 provides strong evidence that these efforts have at least temporarily changed the relationship between stocks and the other asset classes (see Three Fundamental Metrics That Matter.) |
| Many talking heads on the financial news are telling listeners that stocks were the place to be and to use weakness to add to positions. They are assuming that low interest rates and overly accommodative monetary policy will continue to favor stocks. But this advice is based on the assumption that stocks can continue to defy the downward pull of emerging markets and commodities indefinitely, contrary to their historic intermarket relationships. |
| Unfortunately for those who follow this advice, it will work until it doesn't and markets finally suffer through a very painful but necessary reversion to the mean. Suggested Reading: Blackman, Matt [2013] "Three Fundamental Metrics That Matter," Working-Money.com, May 29 |
Matt Blackman is a full-time technical and financial writer and trader. He produces corporate and financial newsletters, and assists clients in getting published in the mainstream media. He is the host of TradeSystemGuru.com. Matt has earned the Chartered Market Technician (CMT) designation. Find out what stocks and futures Matt is watching on Twitter at www.twitter.com/RatioTrade
| Company: | TradeSystemGuru.com |
| Address: | Box 2589 |
| Garibaldi Highlands, BC Canada | |
| Phone # for sales: | 604-898-9069 |
| Fax: | 604-898-9069 |
| Website: | www.tradesystemguru.com |
| E-mail address: | indextradermb@gmail.com |
Traders' Resource Links | |
| TradeSystemGuru.com has not added any product or service information to TRADERS' RESOURCE. | |
Click here for more information about our publications!
Comments

Request Information From Our Sponsors
- StockCharts.com, Inc.
- Candle Patterns
- Candlestick Charting Explained
- Intermarket Technical Analysis
- John Murphy on Chart Analysis
- John Murphy's Chart Pattern Recognition
- John Murphy's Market Message
- MurphyExplainsMarketAnalysis-Intermarket Analysis
- MurphyExplainsMarketAnalysis-Visual Analysis
- StockCharts.com
- Technical Analysis of the Financial Markets
- The Visual Investor
- VectorVest, Inc.
- Executive Premier Workshop
- One-Day Options Course
- OptionsPro
- Retirement Income Workshop
- Sure-Fire Trading Systems (VectorVest, Inc.)
- Trading as a Business Workshop
- VectorVest 7 EOD
- VectorVest 7 RealTime/IntraDay
- VectorVest AutoTester
- VectorVest Educational Services
- VectorVest OnLine
- VectorVest Options Analyzer
- VectorVest ProGraphics v6.0
- VectorVest ProTrader 7
- VectorVest RealTime Derby Tool
- VectorVest Simulator
- VectorVest Variator
- VectorVest Watchdog