HOT TOPICS LIST
- MACD
- Fibonacci
- RSI
- Gann
- ADXR
- Stochastics
- Volume
- Triangles
- Futures
- Cycles
- Volatility
- ZIGZAG
- MESA
- Retracement
- Aroon
INDICATORS LIST
LIST OF TOPICS
PRINT THIS ARTICLE
by Chaitali Mohile
SAIA is one stable stock that can be considered for long-term trading.
Position: Hold
Chaitali Mohile
Active trader in the Indian stock markets since 2003 and a full-time writer. Trading is largely based upon technical analysis.
PRINT THIS ARTICLE
FLAGS AND PENNANTS
SAIA - A Strong Stock
07/01/13 03:54:23 PMby Chaitali Mohile
SAIA is one stable stock that can be considered for long-term trading.
Position: Hold
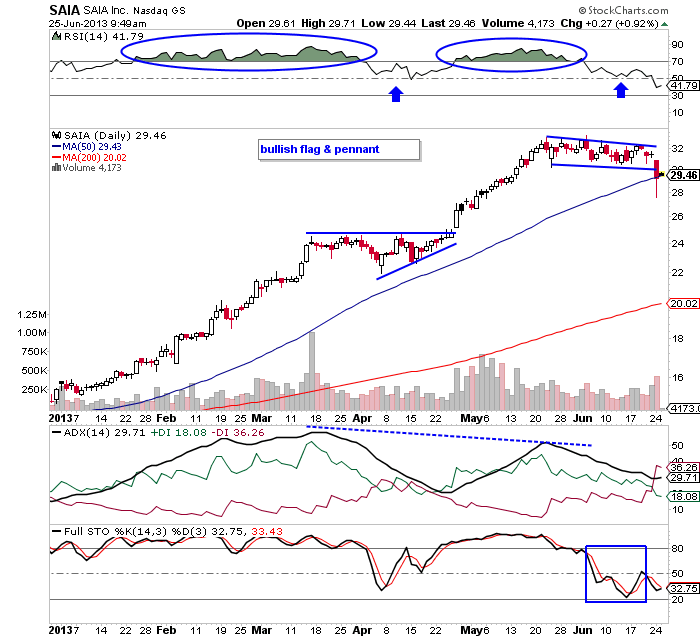
| Flags & pennants are classic chart formations that help to identify the stability and breakout pattern of a particular stock or index. SAIA Inc. (SAIA) formed the bullish flag & pennant during its upwards journey. The consolidated price movement accumulated strength and offered resting time to the existing advance rally. According to the daily chart in Figure 1, the bullish rally of SAIA consolidated from mid March to mid April 2013. This was the first bullish flag & pennant formed by the stock. The pattern breaks upwards and resumes the previous advance rally. |
| The relative strength index (RSI)(14) and the full stochastic(14,3,3) in Figure 1 were overbought for about three months. The average directional index (ADX)(14) indicated overheated uptrend. These extreme bullish conditions reflected reversal possibilities. Hence, the swiftly moving price rally turned sideways. During consolidation, all three indicators retraced from extreme levels to comfortable bullish levels. This created room for the further rally. Eventually, the bullish flag & pennant pattern breached upwards and continued its journey. |

|
| FIGURE 1: SAIA, DAILY. |
| Graphic provided by: StockCharts.com. |
| |
| After the breakout, SAIA surged to $32. The 50-day moving average (MA) escorted the entire rally in Figure 1. In the meantime, the indicators once again turned overheated, resulting in consolidation. As the rally moved sideways, all three indicators began declining from overbought regions. This horizontal movement formed another bullish flag & pennant pattern in Figure 1. The formation is yet to break upwards. Currently, the ADX(14) is indicating the developing uptrend, the RSI(14) is ready to establish support at the center line, and the stochastic oscillator is shaky marginally below the 50 levels. Thus, SAIA would sustain its bullish consolidation and break upwards. |

|
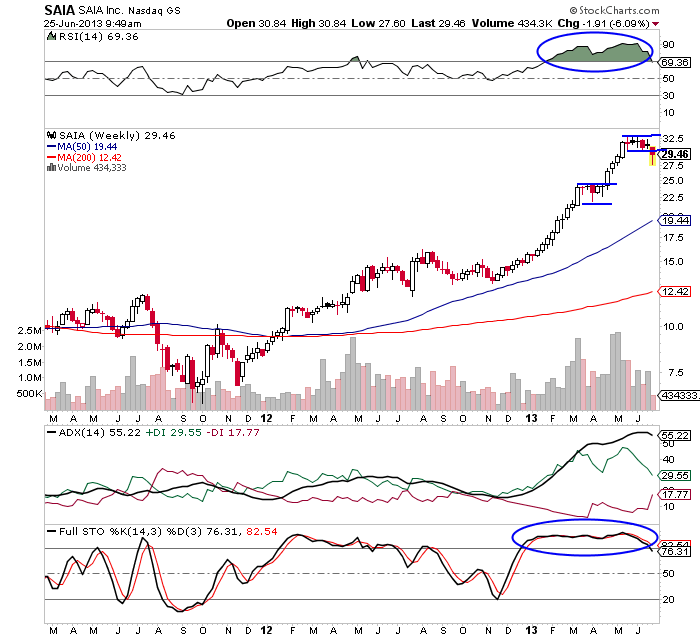
| FIGURE 2: SAIA, WEEKLY. |
| Graphic provided by: StockCharts.com. |
| |
| The bullish flag & pennant is also formed on the weekly time frame chart in Figure 2. Since the same pattern has occurred on two time frames, its reliability has increased. Once again, the indicators are extremely bullish, reflecting trend reversal possibilities. Therefore, SAIA would consolidate till the indicators become healthily bullish. We can calculate the minimum estimated levels by adding the length of the flagpole to the breakout point. Therefore, 32-25= 7 (length of flag pole) + 32 (breakout point) = 39 is the short-term target for the future breakout rally. |
| To conclude, you could add a strong stock like SAIA to your portfolio. |
Active trader in the Indian stock markets since 2003 and a full-time writer. Trading is largely based upon technical analysis.
| Company: | Independent |
| Address: | C1/3 Parth Indraprasth Towers. Vastrapur |
| Ahmedabad, Guj 380015 | |
| E-mail address: | chaitalimohile@yahoo.co.in |
Traders' Resource Links | |
| Independent has not added any product or service information to TRADERS' RESOURCE. | |
Click here for more information about our publications!
PRINT THIS ARTICLE

Request Information From Our Sponsors
- StockCharts.com, Inc.
- Candle Patterns
- Candlestick Charting Explained
- Intermarket Technical Analysis
- John Murphy on Chart Analysis
- John Murphy's Chart Pattern Recognition
- John Murphy's Market Message
- MurphyExplainsMarketAnalysis-Intermarket Analysis
- MurphyExplainsMarketAnalysis-Visual Analysis
- StockCharts.com
- Technical Analysis of the Financial Markets
- The Visual Investor
- VectorVest, Inc.
- Executive Premier Workshop
- One-Day Options Course
- OptionsPro
- Retirement Income Workshop
- Sure-Fire Trading Systems (VectorVest, Inc.)
- Trading as a Business Workshop
- VectorVest 7 EOD
- VectorVest 7 RealTime/IntraDay
- VectorVest AutoTester
- VectorVest Educational Services
- VectorVest OnLine
- VectorVest Options Analyzer
- VectorVest ProGraphics v6.0
- VectorVest ProTrader 7
- VectorVest RealTime Derby Tool
- VectorVest Simulator
- VectorVest Variator
- VectorVest Watchdog
