

HOT TOPICS LIST
- MACD
- Fibonacci
- RSI
- Gann
- ADXR
- Stochastics
- Volume
- Triangles
- Futures
- Cycles
- Volatility
- ZIGZAG
- MESA
- Retracement
- Aroon
INDICATORS LIST
LIST OF TOPICS
PRINT THIS ARTICLE
by Donald W. Pendergast, Jr.
Down by as much as 34% in just the past seven weeks, shares of Petrobrasileira S.A. may finally be at or near a key bullish reversal area.
Position: N/A
Donald W. Pendergast, Jr.
Freelance financial markets writer and online publisher of the Trendzetterz.com S&P 500 Weekly Forecast service.
PRINT THIS ARTICLE
REVERSAL
PBR: Onset Of A Bullish Reversal?
06/27/13 02:33:37 PMby Donald W. Pendergast, Jr.
Down by as much as 34% in just the past seven weeks, shares of Petrobrasileira S.A. may finally be at or near a key bullish reversal area.
Position: N/A
| Like some other big 'BRIC' (Brazil, Russia, India and China) stocks, shares of Petrobrasileira S.A. (PBR) have really been hit hard over the past few years; for the second half of the previous decade, major energy, basic materials, and financial stocks from each of these developing nations went on major multiyear bullish tears before getting hammered hard in the 2008 global financial crisis. After a sharp rebound into 2009/2010/2011 many of these same stocks peaked again and have never really recovered – as is the case for PBR. Patient traders and investors, however, may have just been given a low risk buying or put option selling opportunity in the stock and that's the focus of today's article. |
|
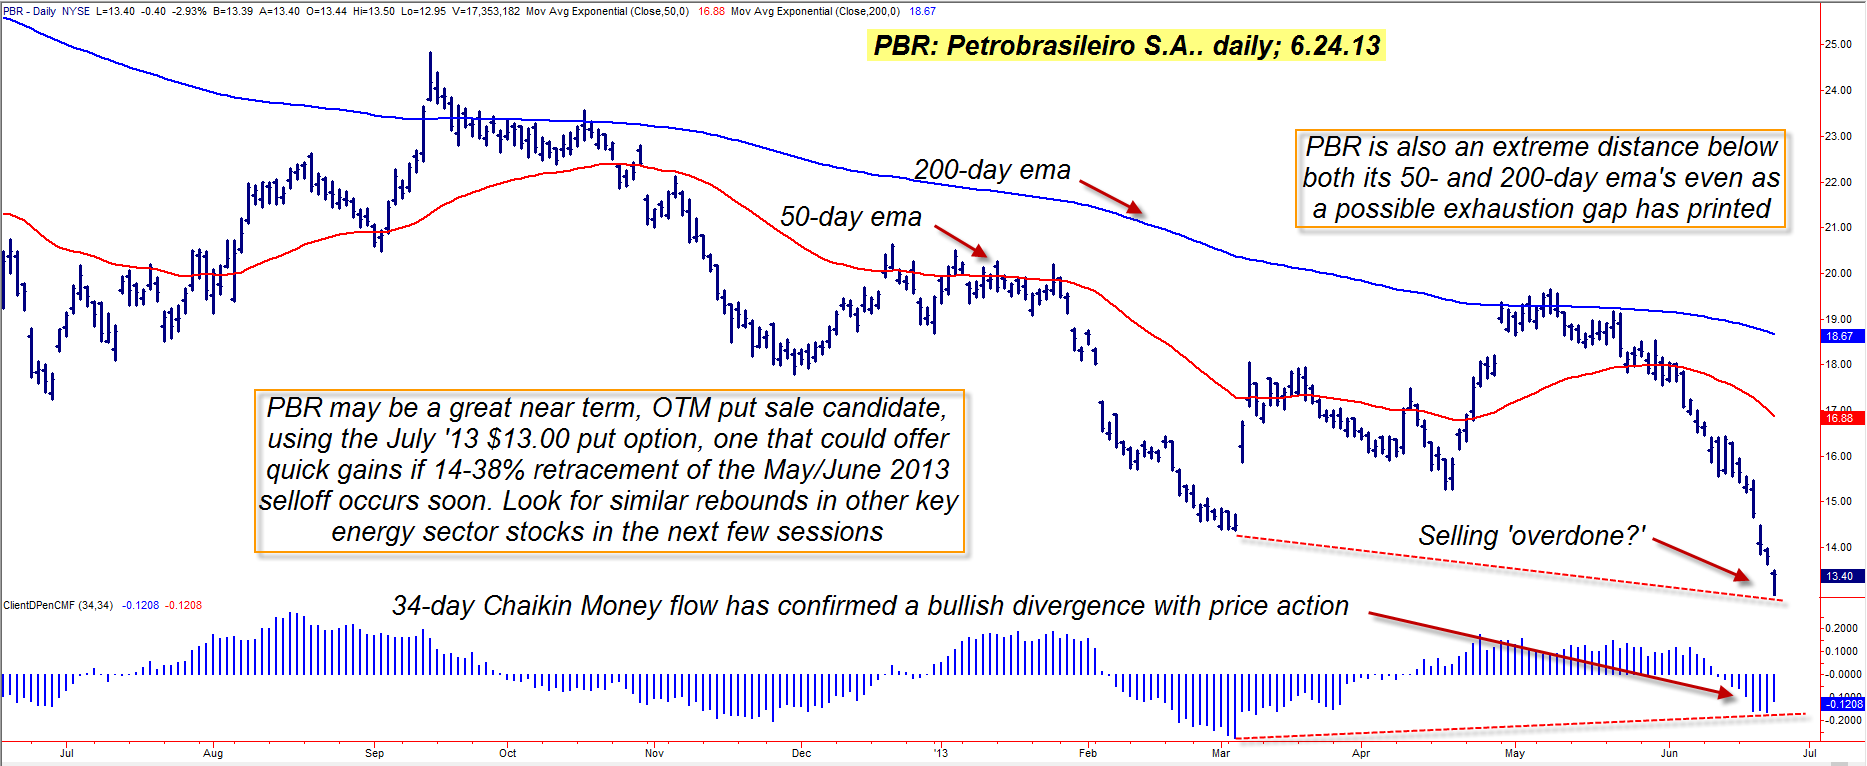
| Figure 1: Any time an exhaustion gap appears after a severe decline, skilled traders look for additional signs that a key support zone has been reached; in this case the bullish price/money flow divergence is a strong hint that a reversal may be in the works for PBR. |
| Graphic provided by: TradeStation. |
| |
| Pretty grim looking now, isn't it – PBR's daily chart in Figure 1, that is – just look at all of the obviously bearish chart dynamics here: 1. The stock is trading way below its 50- and 200- day exponential moving averages (EMAs), both averages are sloping lower and the spread between the averages is increasing – implying increasing downside momentum. 2. PBR has been making lower daily closes in the majority of the trading sessions since its last swing high of May 8, 2013. 3. The "waterfall" shape of the decline, although less severe than a decline beginning with a major 5 or 10% bearish gap (a "shock" sell-off), tells traders and investors that the "smart money" have already sold out and are simply not looking to build a major new position in the stock, or so it might seem. Truly, those technicals are awful, but when you look at two other key chart dynamics, a bullish breeze seems to appear, one driving away at least some of the clouds of market doom-and-gloom: 1. Notice that the 34-day Chaikin Money flow histogram (CMF)(34) has just confirmed a substantially bullish divergence with price action on the chart – implying some accumulation already underway. 2 They may be hard to see because of the small scale of the chart, but there are indeed three minor bearish gaps on PBR's daily graph, with the last one looking very much like a classic "exhaustion gap" pattern – the kind typically seen right near the end of a major, swift decline in a given market. 3. Monday's daily price bar also shows a strong bullish intraday reversal; price dipped as low as 12.95 after opening at 13.44; as this is written, PBR is trading back up near the 13.40 level. While it's still possible for PBR to drop even further, shorting the stock on a daily time frame looks like a low-probability trade at this point. It's also a bit too early to buy, but be aware that a valid buy signal occurs as soon as PBR manages to rise above Monday's high of 13.51. |
|
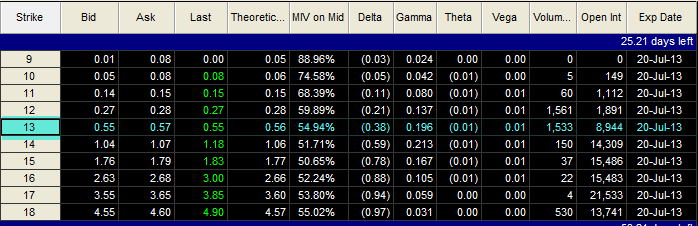
| Figure 2: The July '13 PBR puts have a large open interest figure of 8,900-plus contracts, a modest bid/ask spread and a daily time decay factor of $2/day per contract. |
| Graphic provided by: TradeStation. |
| Graphic provided by: TradeStation Options Analysis. |
| |
| Aggressive bears will want to consider a rise above 13.51 in PBR as a signal to sell the July '13 PBR $13.00 put option; this put has a very close bid/ask spread, a daily time decay (theta) factor of $2 per day/per contract and a huge open interest figure of better than 8,900 contracts. The trade plan is simple: 1. Risk no more than 1% of your account equity on this trade. 2. If PBR hits 14.68 (its next key resistance level) or if the put's value drops by 50 to 60%, buy it back for a nice profit. 3. If PBR drops to 13.00, or if the put increases in value by 80 to 90% (whichever happens first), buy the put back for a loss and wait for a better trade setup to appear. This is one of those trade setups that appears to be potentially bullish – short term – and with modest downside risk, and the odds for more bullish follow through appear to be way above average here. But don't commit any funds to this trade until PBR clearly breaks above the 13.51 level; it's much safer than to just buy now before the break above Monday's high in the stock. Trade wisely until we meet here again. |
Freelance financial markets writer and online publisher of the Trendzetterz.com S&P 500 Weekly Forecast service.
| Title: | Market consultant and writer |
| Company: | Trendzetterz |
| Address: | 81 Hickory Hollow Drive |
| Crossville, TN 38555 | |
| Phone # for sales: | 904-303-4814 |
| Website: | trendzetterz.com |
| E-mail address: | support@trendzetterz.com |
Traders' Resource Links | |
| Trendzetterz has not added any product or service information to TRADERS' RESOURCE. | |
Click here for more information about our publications!
PRINT THIS ARTICLE

Request Information From Our Sponsors
- StockCharts.com, Inc.
- Candle Patterns
- Candlestick Charting Explained
- Intermarket Technical Analysis
- John Murphy on Chart Analysis
- John Murphy's Chart Pattern Recognition
- John Murphy's Market Message
- MurphyExplainsMarketAnalysis-Intermarket Analysis
- MurphyExplainsMarketAnalysis-Visual Analysis
- StockCharts.com
- Technical Analysis of the Financial Markets
- The Visual Investor
- VectorVest, Inc.
- Executive Premier Workshop
- One-Day Options Course
- OptionsPro
- Retirement Income Workshop
- Sure-Fire Trading Systems (VectorVest, Inc.)
- Trading as a Business Workshop
- VectorVest 7 EOD
- VectorVest 7 RealTime/IntraDay
- VectorVest AutoTester
- VectorVest Educational Services
- VectorVest OnLine
- VectorVest Options Analyzer
- VectorVest ProGraphics v6.0
- VectorVest ProTrader 7
- VectorVest RealTime Derby Tool
- VectorVest Simulator
- VectorVest Variator
- VectorVest Watchdog