HOT TOPICS LIST
- MACD
- Fibonacci
- RSI
- Gann
- ADXR
- Stochastics
- Volume
- Triangles
- Futures
- Cycles
- Volatility
- ZIGZAG
- MESA
- Retracement
- Aroon
INDICATORS LIST
LIST OF TOPICS
PRINT THIS ARTICLE
by Koos van der Merwe
As the economy recovers - this was confirmed by Federal Reserve Chairman Ben Bernanke last week - so will Intertape Polymer.
Position: Buy
Koos van der Merwe
Has been a technical analyst since 1969, and has worked as a futures and options trader with First Financial Futures in Johannesburg, South Africa.
PRINT THIS ARTICLE
TECHNICAL ANALYSIS
Intertape Polymer
06/27/13 02:14:57 PMby Koos van der Merwe
As the economy recovers - this was confirmed by Federal Reserve Chairman Ben Bernanke last week - so will Intertape Polymer.
Position: Buy
| IPG (Intertape Polymer Group) manufactures a broad range of packaging products and systems for both industrial and retail customers. These include one of the largest offerings of tape available: pressure sensitive and water-activated, carton-sealing, masking, filament, flatback, cloth/duct, double-coated, high performance specialty, electrical, automotive, and HVAC tapes. The company also manufactures shrink film and stretch film as well as carton-sealing equipment, ink jet printing systems and labelling systems. Established in 1981 with headquarters in Montreal, Quebec, and Bradenton, Florida, IPG employs approximately 2,000 employees with operations in 16 locations, including 11 manufacturing facilities in North America and one in Europe. |

|
| Figure 1. Monthly Chart. |
| Graphic provided by: AdvancedGET. |
| |
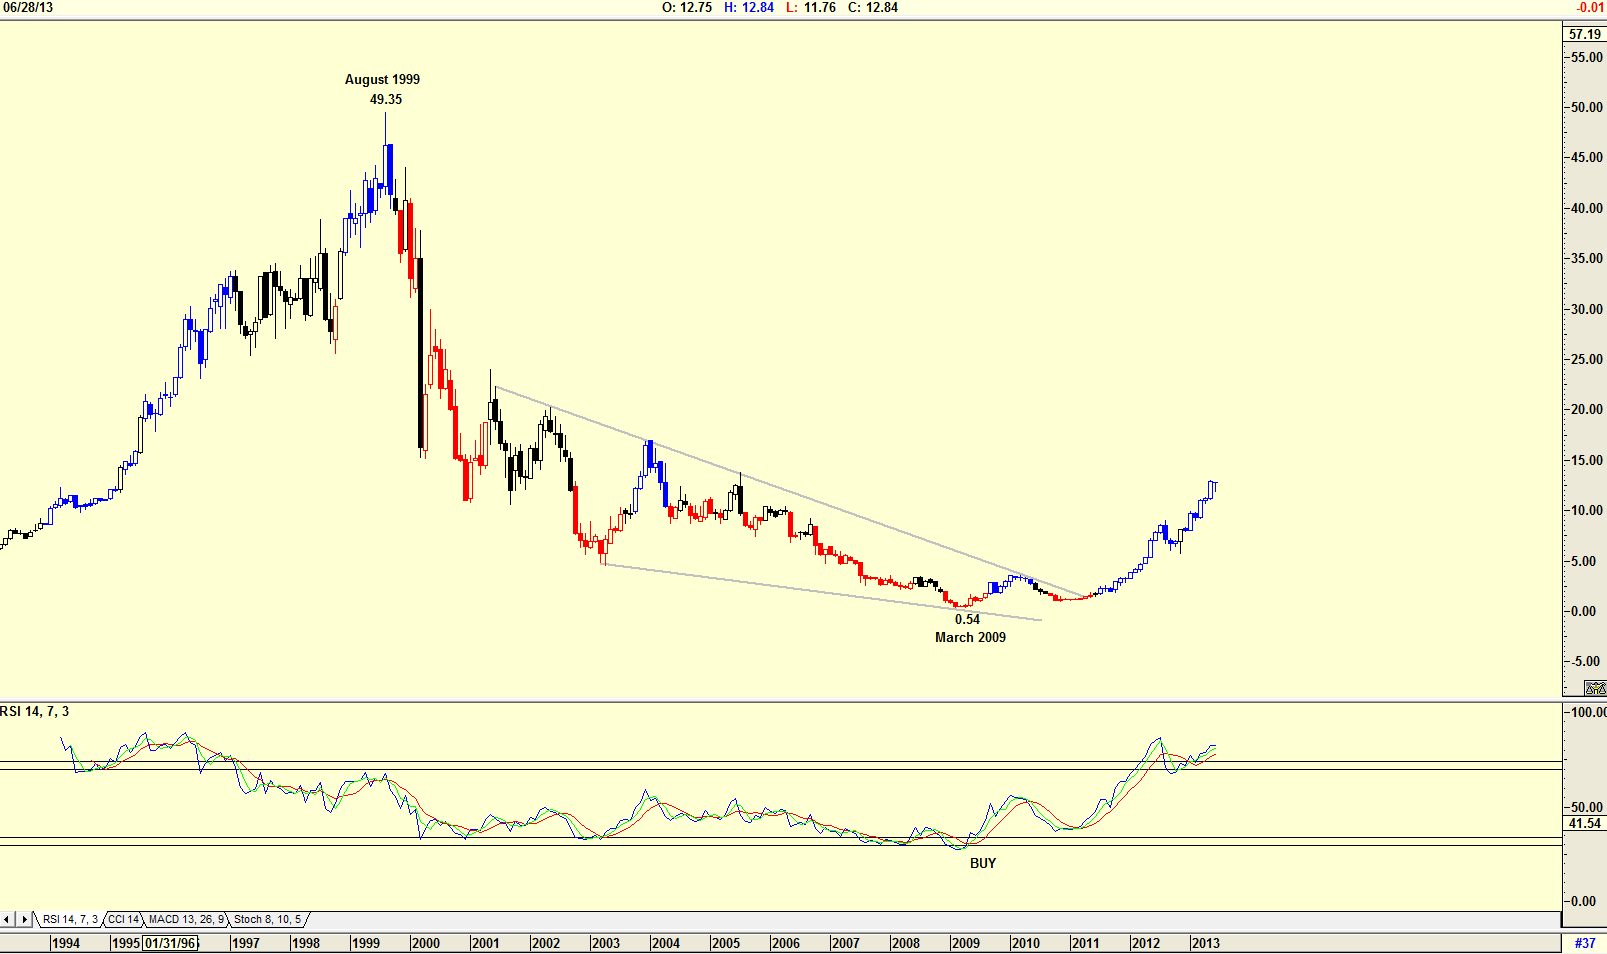
| The monthly chart in Figure 1 shows how the price fell from a high of $49.35 in August 1999 as the technology bubble started to burst, to a low of 59 cents by March 2009. From that date the share price started recovering as the economy started recovering. However, with the price presently at $12.84 and the RSI indicator at overbought levels, the share price on the monthly chart is not a buy. |

|
| Figure 2. Weekly Chart |
| Graphic provided by: AdvancedGET. |
| |
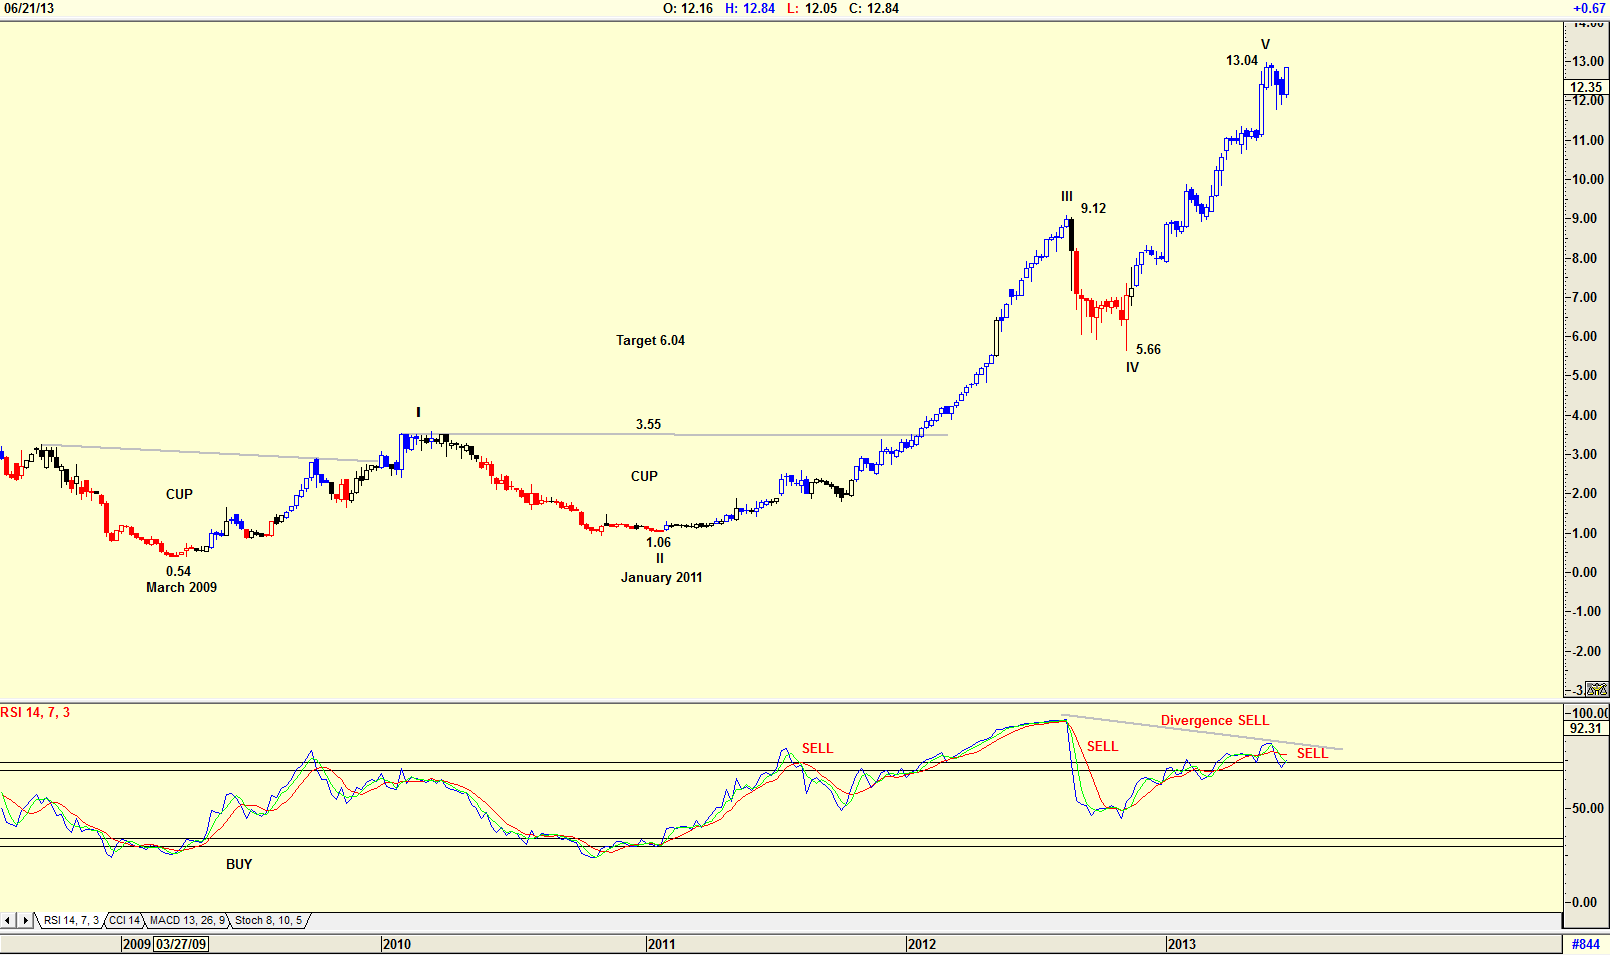
| The weekly chart in Figure 2 shows the two cup & handle formations that developed, the second one suggesting a target of $6.04 (3.55 - 1.06 = 2.49 + 3.55 =6.04). As one can see the share price continued to rise strongly even though the RSI was at overbought levels, suggesting a sell. The Elliott Wave count is showing that a Wave V is complete at $13.04 and with the RSI showing a divergence sell, the price should fall to somewhere in the fourth wave, between $5.66 and $9.12. |

|
| Figure 3. Daily Chart |
| Graphic provided by: Omnitrader. |
| |
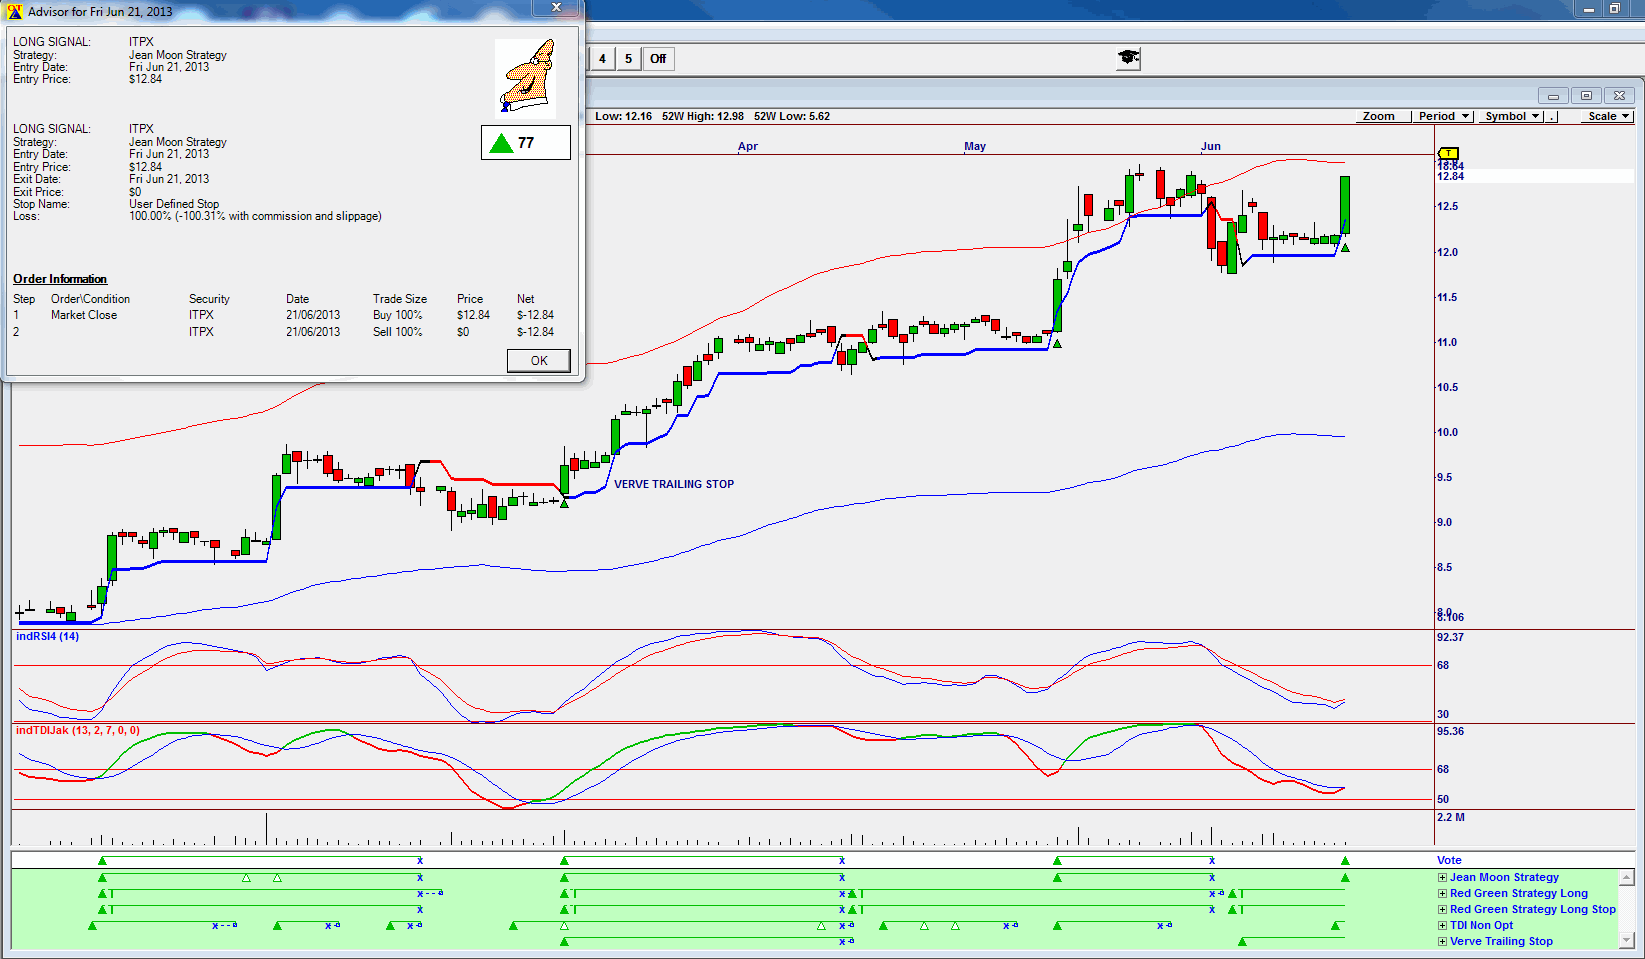
| The daily chart in Figure 3 shows the buy signal received on the vote line, a summation of the various strategies shown in green below the vote line, on June 21, 2013. Looking at previous buy signals given, you can see how profitable the signals were. With an advisor rating of 77, buying the share for the short-term looks comfortable. The RSI indicator and the TDI indicator are both suggesting a buy. I would be a buyer of IPG at present levels, but with the monthly and weekly charts suggesting a sell, I would keep my stop signals close, and watch the Verve trailing stop for any hint of a sell. |
Has been a technical analyst since 1969, and has worked as a futures and options trader with First Financial Futures in Johannesburg, South Africa.
| Address: | 3256 West 24th Ave |
| Vancouver, BC | |
| Phone # for sales: | 6042634214 |
| E-mail address: | petroosp@gmail.com |
Click here for more information about our publications!
PRINT THIS ARTICLE

Request Information From Our Sponsors
- StockCharts.com, Inc.
- Candle Patterns
- Candlestick Charting Explained
- Intermarket Technical Analysis
- John Murphy on Chart Analysis
- John Murphy's Chart Pattern Recognition
- John Murphy's Market Message
- MurphyExplainsMarketAnalysis-Intermarket Analysis
- MurphyExplainsMarketAnalysis-Visual Analysis
- StockCharts.com
- Technical Analysis of the Financial Markets
- The Visual Investor
- VectorVest, Inc.
- Executive Premier Workshop
- One-Day Options Course
- OptionsPro
- Retirement Income Workshop
- Sure-Fire Trading Systems (VectorVest, Inc.)
- Trading as a Business Workshop
- VectorVest 7 EOD
- VectorVest 7 RealTime/IntraDay
- VectorVest AutoTester
- VectorVest Educational Services
- VectorVest OnLine
- VectorVest Options Analyzer
- VectorVest ProGraphics v6.0
- VectorVest ProTrader 7
- VectorVest RealTime Derby Tool
- VectorVest Simulator
- VectorVest Variator
- VectorVest Watchdog
