

HOT TOPICS LIST
- MACD
- Fibonacci
- RSI
- Gann
- ADXR
- Stochastics
- Volume
- Triangles
- Futures
- Cycles
- Volatility
- ZIGZAG
- MESA
- Retracement
- Aroon
INDICATORS LIST
LIST OF TOPICS
PRINT THIS ARTICLE
by Donald W. Pendergast, Jr.
Shares of Iron Mountain (IRM) are down by nearly 30% in the last nine weeks, with even more downside possible.
Position: N/A
Donald W. Pendergast, Jr.
Freelance financial markets writer and online publisher of the Trendzetterz.com S&P 500 Weekly Forecast service.
PRINT THIS ARTICLE
KELTNER CHANNELS
Iron Mountain: Down In The Dumps
06/27/13 02:06:24 PMby Donald W. Pendergast, Jr.
Shares of Iron Mountain (IRM) are down by nearly 30% in the last nine weeks, with even more downside possible.
Position: N/A
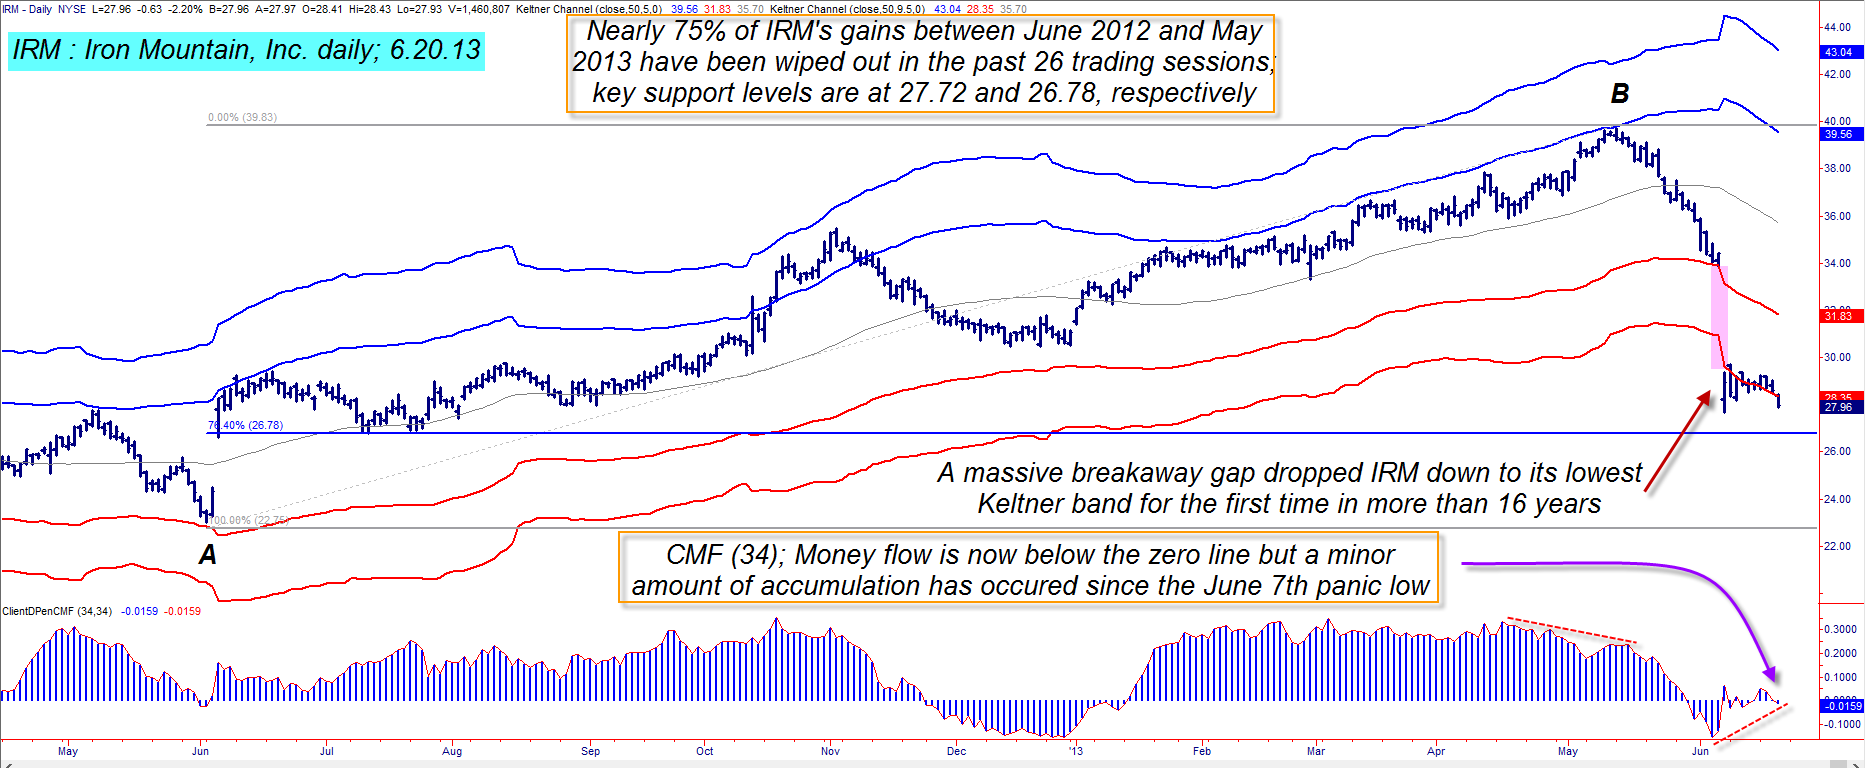
| You know a stock is in a major bearish trend move any time that its extreme lower levels of statistical support is reached (based on certain Keltner Channel configurations), especially if such a touch of this key support level is made for the first time in more than 16 years. Here's a look at the still-developing down trend in shares of Iron Mountain, Inc. (IRM) along with a possible way to play further weakness in this large cap S&P 500 component stock (Figure 1). |
|
| Figure 1: Shares of Iron Mountain, Inc. (IRM) recently touched its extreme lower Keltner band – for the first time in more than 16 years. The probabilities for deeper declines for IRM during the next few months are fairly high. |
| Graphic provided by: TradeStation. |
| |
| Not so long ago, IRM was in the midst of a very persistent, strong rally – starting in June 2012 at 23.03 and then running as high as 39.71 on May 13, 2013 – making gains of as much as 72% in less than a year. Once that major cycle high printed, however, the selling began the next day and has been remarkably bearish since the high was made, with IRM down in 19 of its last 25 trading sessions. During the decline, a huge bearish gap (nearly an 18% decline in one day) printed as well, one that also decimated any semblance of key 200-day moving average support. This massive, sudden decline wasn't related to any quarterly earnings release in the stock either, as its last report had earnings in line with Wall Street expectations (IRM did have earnings misses during the previous two reporting periods, however). Obviously, some very "strong" hands who had helped drive the price up so dramatically had decided to unwind their positions starting in the second half of April 2013 (note the money flow divergence with price) and that was one of the clues that some sort of a reversal was on the way. Now that the technical damage has been done, traders and investors need to size up the stock's current chart dynamics; from all appearances, the line of least resistance in IRM is toward even lower valuations. If that panic low of June 7, 2013 (at 27.72) is taken out soon, another wave of selling pressure is likely to be unleashed – one that could quickly drive IRM back down to the Fibonacci 76.4% retracement of major swing AB. That's at 26.78 and it could be a place where some "smart money" steps in to take a partial position – but don't bet the farm on that happening. |
|
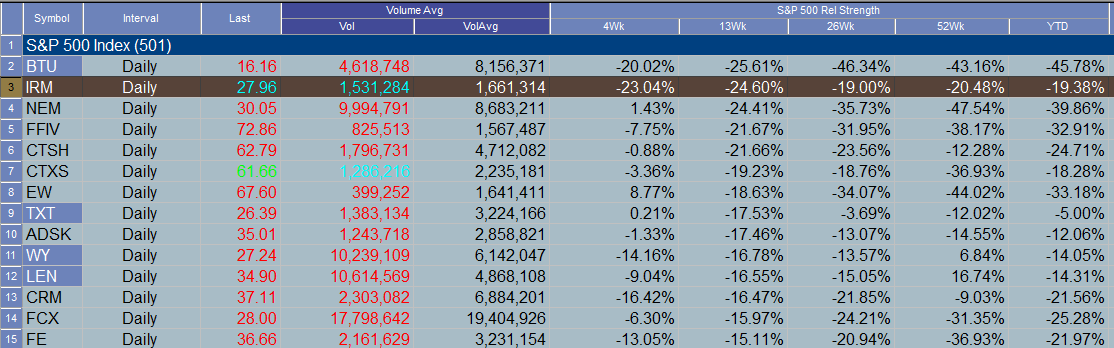
| Figure 2: IRM has been significantly underperforming the S&P 500 index (.SPX) over the past 4-, 13-, 26- and 52-week periods. It's also down by more than 19% year-to-date. |
| Graphic provided by: TradeStation. |
| Graphic provided by: TradeStation Radar Screen. |
| |
| Now that IRM is actually trading beneath the lowest Keltner band (set at 9.5 average true ranges away from a 50-period moving average), traders simply need to let the move play out before even thinking of calling a bottom; in fact, once 27.72 is breached, the simplest way to try and extract profits from IRM's woes is to short the stock, risking no more than 2% of your account equity. Thursday's (June 20) high of 28.43 can serve as your initial stop after getting filled and then a simple two-bar trailing stop of the daily highs can help you manage the trade until final stop out. Again, the Fib support near 26.78 may be a place to expect a bounce, so consider taking at least half your profits off at that level, should IRM decline as anticipated; short-covering rallies usually appear when you least expect them and you want to watch any short position carefully to avoid having your hard won profits vaporized before your eyes. Trade wisely until we meet here again. |
Freelance financial markets writer and online publisher of the Trendzetterz.com S&P 500 Weekly Forecast service.
| Title: | Market consultant and writer |
| Company: | Trendzetterz |
| Address: | 81 Hickory Hollow Drive |
| Crossville, TN 38555 | |
| Phone # for sales: | 904-303-4814 |
| Website: | trendzetterz.com |
| E-mail address: | support@trendzetterz.com |
Traders' Resource Links | |
| Trendzetterz has not added any product or service information to TRADERS' RESOURCE. | |
Click here for more information about our publications!
Comments

Request Information From Our Sponsors
- VectorVest, Inc.
- Executive Premier Workshop
- One-Day Options Course
- OptionsPro
- Retirement Income Workshop
- Sure-Fire Trading Systems (VectorVest, Inc.)
- Trading as a Business Workshop
- VectorVest 7 EOD
- VectorVest 7 RealTime/IntraDay
- VectorVest AutoTester
- VectorVest Educational Services
- VectorVest OnLine
- VectorVest Options Analyzer
- VectorVest ProGraphics v6.0
- VectorVest ProTrader 7
- VectorVest RealTime Derby Tool
- VectorVest Simulator
- VectorVest Variator
- VectorVest Watchdog
- StockCharts.com, Inc.
- Candle Patterns
- Candlestick Charting Explained
- Intermarket Technical Analysis
- John Murphy on Chart Analysis
- John Murphy's Chart Pattern Recognition
- John Murphy's Market Message
- MurphyExplainsMarketAnalysis-Intermarket Analysis
- MurphyExplainsMarketAnalysis-Visual Analysis
- StockCharts.com
- Technical Analysis of the Financial Markets
- The Visual Investor