

HOT TOPICS LIST
- MACD
- Fibonacci
- RSI
- Gann
- ADXR
- Stochastics
- Volume
- Triangles
- Futures
- Cycles
- Volatility
- ZIGZAG
- MESA
- Retracement
- Aroon
INDICATORS LIST
LIST OF TOPICS
PRINT THIS ARTICLE
by Chaitali Mohile
The tricky rally of Fluidigm Corp. has established strong support.
Position: Sell
Chaitali Mohile
Active trader in the Indian stock markets since 2003 and a full-time writer. Trading is largely based upon technical analysis.
PRINT THIS ARTICLE
CANDLESTICK CHARTING
FLDM Is Consolidating
06/25/13 03:58:29 PMby Chaitali Mohile
The tricky rally of Fluidigm Corp. has established strong support.
Position: Sell
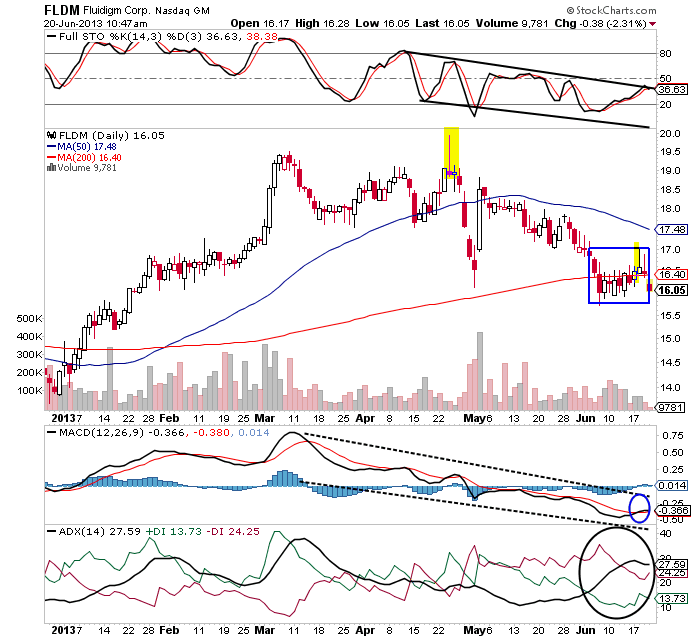
| A bullish moving average breakout of Fluidigm Corp (FLDM) was engulfed with bearish pressures. The daily chart of FLDM in Figure 1 is filled with long upper and lower shadows, doji candlesticks and bearish (red) candlesticks. The bullish (white) candlesticks with upper shadows formed immediately after the breakout. This suggests that the stock was unable to sustain at the intraday high. However, FLDM continued its upwards journey. A bullish moving average crossover on the price chart in Figure 1 and a freshly developed uptrend, increased bullish sentiments in the rally. |
| The declining full stochastic (14,3,3) formed negative divergence, suggesting a bearish reversal for FLDM. The narrow gap between the trigger line and MACD line of the moving average convergence/divergence (MACD)(12,26,9) increased volatility and uncertainty in the rally. Meanwhile, the developing uptrend turned overheated. Due to these bearish indications, FLDM reversed from $20. The stock struggled to establish support at the 50-day moving average (MA). FLDM tried to regain with the support of short-term MA, however, the rally failed to sustain at the top. A shooting star – bearish reversal candlestick – was formed at $20, initiating a strong declining rally. |
|
| FIGURE 1: FLDM, DAILY. |
| Graphic provided by: StockCharts.com. |
| |
| Thereafter, FLDM witnessed a free fall. The stock dropped to 16.43 levels, losing approximately four points. The MACD(12,26,9) descended from positive to negative territory. The uptrend reversed as price moved closer to the 200-day moving average (MA). However, FLDM weathered this bearish force and managed to established support at the long-term MA. The stock is now waiting for a fresh directional breakout. Once again the shooting star candlestick pattern has appeared near support. Although FLDM is consolidating near MA support, there is a possibility of a bearish breakout. |
| The candlesticks formed during the consolidation are closing near or below the 200-day MA (see blue box). A shooting star is followed by a red doji with small real body is also formed. The developing downtrend and the reluctant stochastic oscillator is likely to gear up the bearish strength. Although the MACD(12,26,9) is likely to form a bullish crossover (see the blue circle in Figure 1), it cannot be considered in isolation. In addition, the momentum indicator has not surged above the trigger line in the past. Therefore, the indicators and the candlesticks are suggesting more downside for FLDM. The 50-day MA resistance would restrict bullish price action. |
| Hence, FLDM is a treat for short traders. They can carry forward the trade once the bearish breakout is confirmed. Fresh short positions can be triggered at the breakout point. |
Active trader in the Indian stock markets since 2003 and a full-time writer. Trading is largely based upon technical analysis.
| Company: | Independent |
| Address: | C1/3 Parth Indraprasth Towers. Vastrapur |
| Ahmedabad, Guj 380015 | |
| E-mail address: | chaitalimohile@yahoo.co.in |
Traders' Resource Links | |
| Independent has not added any product or service information to TRADERS' RESOURCE. | |
Click here for more information about our publications!
PRINT THIS ARTICLE

Request Information From Our Sponsors
- VectorVest, Inc.
- Executive Premier Workshop
- One-Day Options Course
- OptionsPro
- Retirement Income Workshop
- Sure-Fire Trading Systems (VectorVest, Inc.)
- Trading as a Business Workshop
- VectorVest 7 EOD
- VectorVest 7 RealTime/IntraDay
- VectorVest AutoTester
- VectorVest Educational Services
- VectorVest OnLine
- VectorVest Options Analyzer
- VectorVest ProGraphics v6.0
- VectorVest ProTrader 7
- VectorVest RealTime Derby Tool
- VectorVest Simulator
- VectorVest Variator
- VectorVest Watchdog
- StockCharts.com, Inc.
- Candle Patterns
- Candlestick Charting Explained
- Intermarket Technical Analysis
- John Murphy on Chart Analysis
- John Murphy's Chart Pattern Recognition
- John Murphy's Market Message
- MurphyExplainsMarketAnalysis-Intermarket Analysis
- MurphyExplainsMarketAnalysis-Visual Analysis
- StockCharts.com
- Technical Analysis of the Financial Markets
- The Visual Investor