

HOT TOPICS LIST
- MACD
- Fibonacci
- RSI
- Gann
- ADXR
- Stochastics
- Volume
- Triangles
- Futures
- Cycles
- Volatility
- ZIGZAG
- MESA
- Retracement
- Aroon
INDICATORS LIST
LIST OF TOPICS
PRINT THIS ARTICLE
by Donald W. Pendergast, Jr.
Down by about 25% since October 2012, the iShares Gold Trust ETF is now close to a major support zone.
Position: N/A
Donald W. Pendergast, Jr.
Freelance financial markets writer and online publisher of the Trendzetterz.com S&P 500 Weekly Forecast service.
PRINT THIS ARTICLE
iShares Gold Trust: Triple Bottom Pattern
06/21/13 04:58:13 PMby Donald W. Pendergast, Jr.
Down by about 25% since October 2012, the iShares Gold Trust ETF is now close to a major support zone.
Position: N/A
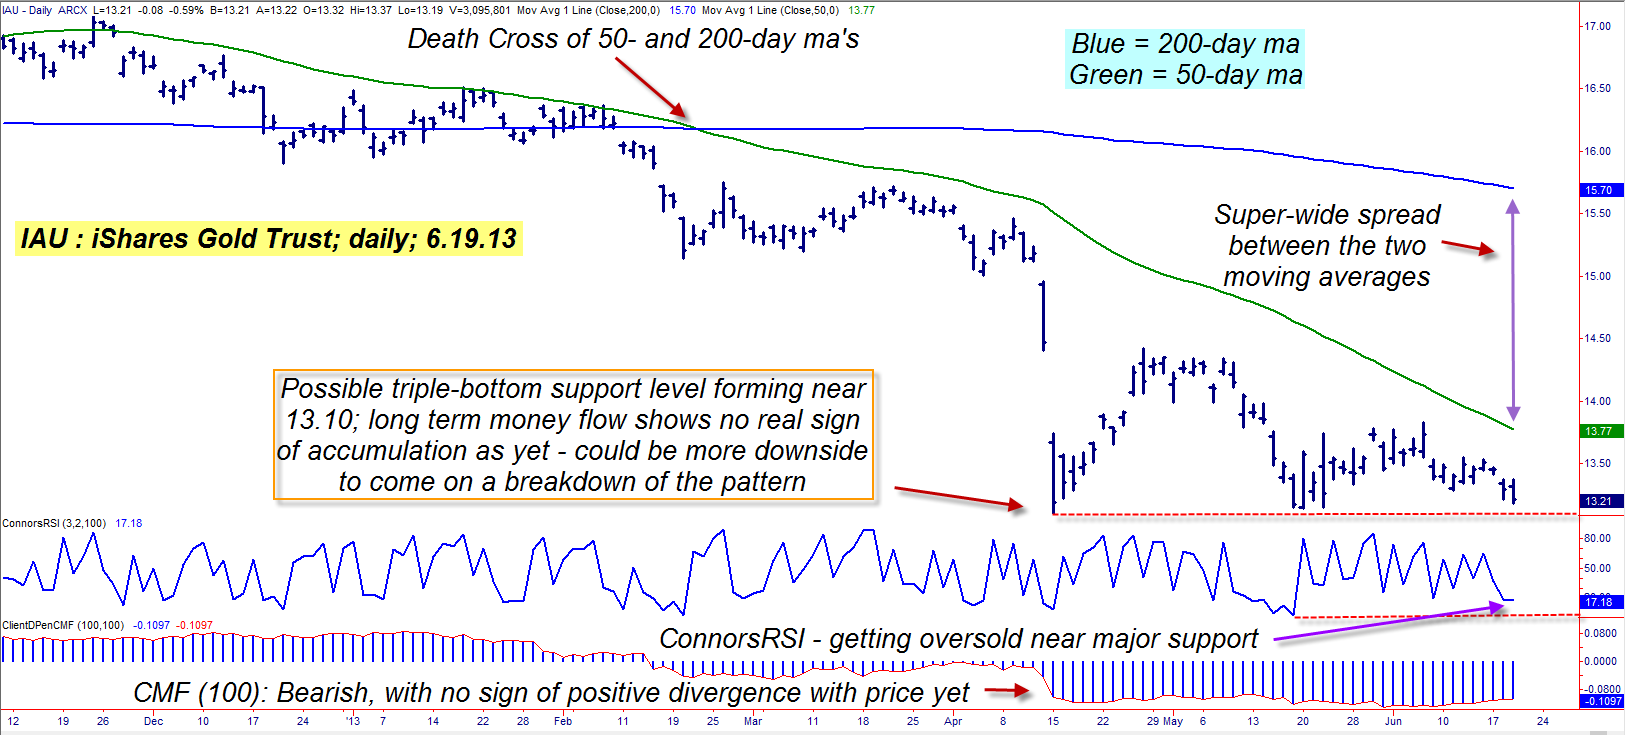
| After making a major high on October 4, 2012, the iShares Gold Trust ETF (IAU) took a significant tumble, steadily selling off to the tune of 25% by April 15, 2013; since then, this key precious metals mining stock fund has managed to hammer out a well formed triple bottom pattern on its daily time frame, one that may – or may not – suggest that a meaningful relief rally is due. Here's a closer look at IAU's daily chart (Figure 1). |
|
| Figure 1: IAU's decline has been arrested by the developing triple bottom pattern on its daily chart. Long term money flow is negative, yet stable, implying that at least some of the fear factor has evaporated in this market. |
| Graphic provided by: TradeStation. |
| |
| Every day, television viewers are bombarded with advertisements to buy gold and silver from a variety of metals dealers. The big sales pitch typically implies that owning either of (or both) these precious metals will help protect you from the ravages of excess government spending and currency debasement (Where's our nation's currency, anyway? Well, of course, it's down in "de basement"). One metals dealer even uses a well-known actor to hold some gold coins in his hand, telling viewers – "Don't you just love the feel of real gold?" Well, I hope the sales pitches work, because nothing seems to be enticing consumers to buy physical precious metals en masse since gold plunged from $2,000 to $1,300 and silver crashed from $49 to $20 – in the span of about two years. The entire global commodities boom that began in the late '90s may already have run its course, including the gold and silver markets, and a further decade of deflation and global economic weakness is the most likely pathway for the world until all of the excessive debts, overbuilding, and overspending of the past 20 years can be finally restructured, liquidated or just finally written off. If deflation and depression are already underway, then forget about owning gold and silver as a means of "protection." Owning cash is the best investment of all during a prolonged deflation/depression, as it is the single asset class that increases in value; buying declining bear-market assets like gold and silver is not a smart long-term move right now; in 5 to ten years both metals could be a screaming buy again, but only the long-term weekly and monthly charts will finally signal the next great buying op for the metals, and there is no signal like that anywhere in sight at the moment. Gold and silver stocks are also down quite a bit (IAU is off by 25% since early October 2012), but are actually getting to a price point where swing traders (not long-term "buy-and-holders") may actually want to monitor its daily chart for new short-term buy signals. |
|
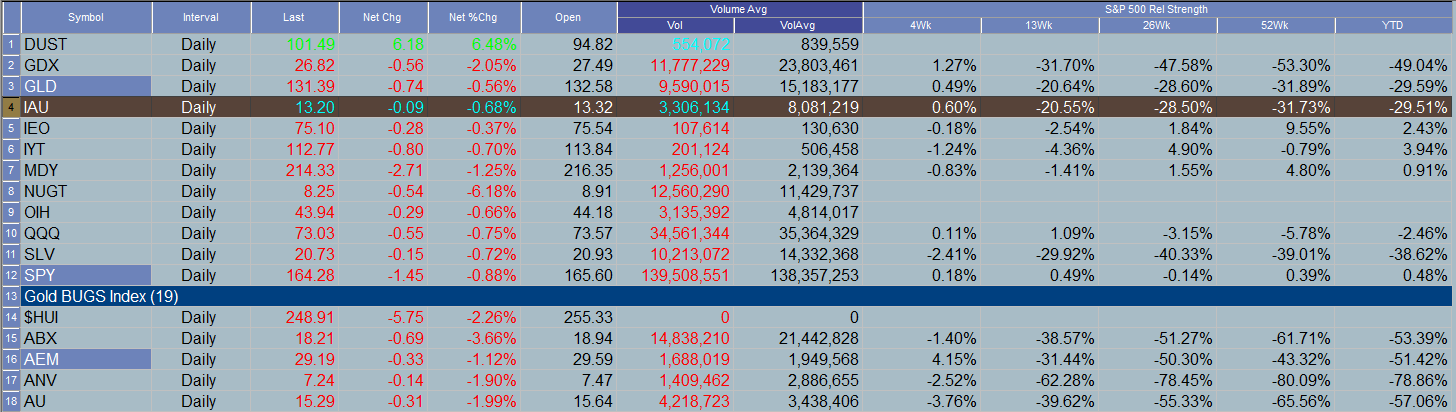
| Figure 2: IAU's comparative relative strength versus the S&P 500 index (.SPX) remains very poor, across all meaningful time periods in the past year. |
| Graphic provided by: TradeStation. |
| Graphic provided by: TradeStation Radar Screen. |
| |
| The "death cross" of IAU's 50-day simple moving average (SMA) beneath its 200-day SMA is the clearest confirmation of the current bear market in precious metals (PM) stocks; note how the most violent part of the decline took place after that crossing in February 2013. Long-term money flow (based on the 100-day Chaikin Money flow histogram [CMF][100]) has been mired in extremely bearish territory since February 2013 as well. IAU's money flow trend seems to have stabilized somewhat in recent weeks, but there still is no sign of any sizable accumulation underway as of late. But that beautiful triple bottom pattern; well, that is definitely worth a second look, as that solid support floor near 13.10 is telling traders that there is strong buying interest each time IAU gets into the lower 13.00 area; should this ETF hit the support line again, it will be fascinating to see if buyers rush in and help launch a tradable bullish swing move or if the bears have the upper hand in driving IAU down into the sub-13.00 zone again. Selling near-term out of the money puts would be a great strategy in IAU after a successful bounce, except that the bid/ask spread in IAU puts is downright awful. Any impending bullish reversal needs to be traded with IAU shares instead of with puts or calls; here's one way to consider playing such a bounce, should it appear: 1. If IAU descends toward support near 13.10, finds a floor, and suddenly surges higher, look to see if the eight-day RSI rises above 60.00 on a closing basis. 2. On a close above 60.00 in the RSI, look to place a buy stop at the high of the bar that made the daily close above 60.00 in the RSI. 3. Once filled on the trade, run a two- to three-bar trailing stop of the daily lows to manage the trade until final stop-out. As this is a reversal trade, try not to risk more than 1% of your account value on it; remember, too, that an early stop out of this long trade might very well set up a new short trade on an eight-day RSI reading of 40.00 or below – so be nimble and ready to act no matter which way this volatile ETF decides to actually go. Trade wisely until we meet here again. |
Freelance financial markets writer and online publisher of the Trendzetterz.com S&P 500 Weekly Forecast service.
| Title: | Market consultant and writer |
| Company: | Trendzetterz |
| Address: | 81 Hickory Hollow Drive |
| Crossville, TN 38555 | |
| Phone # for sales: | 904-303-4814 |
| Website: | trendzetterz.com |
| E-mail address: | support@trendzetterz.com |
Traders' Resource Links | |
| Trendzetterz has not added any product or service information to TRADERS' RESOURCE. | |
Click here for more information about our publications!
Comments
Date:�09/09/13Rank:�3Comment:�

Request Information From Our Sponsors
- StockCharts.com, Inc.
- Candle Patterns
- Candlestick Charting Explained
- Intermarket Technical Analysis
- John Murphy on Chart Analysis
- John Murphy's Chart Pattern Recognition
- John Murphy's Market Message
- MurphyExplainsMarketAnalysis-Intermarket Analysis
- MurphyExplainsMarketAnalysis-Visual Analysis
- StockCharts.com
- Technical Analysis of the Financial Markets
- The Visual Investor
- VectorVest, Inc.
- Executive Premier Workshop
- One-Day Options Course
- OptionsPro
- Retirement Income Workshop
- Sure-Fire Trading Systems (VectorVest, Inc.)
- Trading as a Business Workshop
- VectorVest 7 EOD
- VectorVest 7 RealTime/IntraDay
- VectorVest AutoTester
- VectorVest Educational Services
- VectorVest OnLine
- VectorVest Options Analyzer
- VectorVest ProGraphics v6.0
- VectorVest ProTrader 7
- VectorVest RealTime Derby Tool
- VectorVest Simulator
- VectorVest Variator
- VectorVest Watchdog