

HOT TOPICS LIST
- MACD
- Fibonacci
- RSI
- Gann
- ADXR
- Stochastics
- Volume
- Triangles
- Futures
- Cycles
- Volatility
- ZIGZAG
- MESA
- Retracement
- Aroon
INDICATORS LIST
LIST OF TOPICS
PRINT THIS ARTICLE
by Matt Blackman
After a short correction, US stocks began to rebound as the Dow experienced a number of impressive triple digit days. But not all is well in stock land.
Position: N/A
Matt Blackman
Matt Blackman is a full-time technical and financial writer and trader. He produces corporate and financial newsletters, and assists clients in getting published in the mainstream media. He is the host of TradeSystemGuru.com. Matt has earned the Chartered Market Technician (CMT) designation. Find out what stocks and futures Matt is watching on Twitter at www.twitter.com/RatioTrade
PRINT THIS ARTICLE
MOVING AVERAGES
The Latest Rally - So Where's The Beef?
06/21/13 04:40:48 PMby Matt Blackman
After a short correction, US stocks began to rebound as the Dow experienced a number of impressive triple digit days. But not all is well in stock land.
Position: N/A
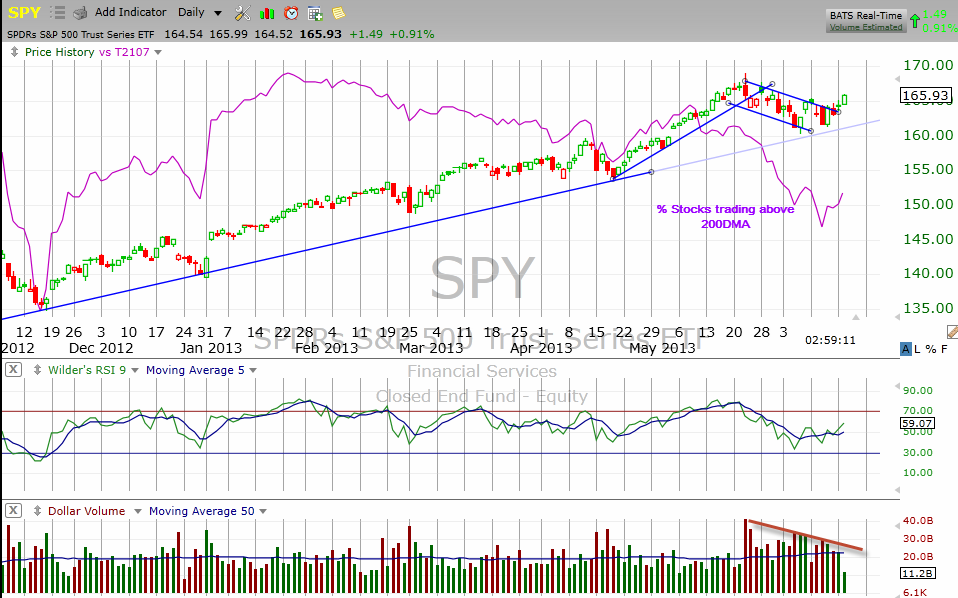
| In the third week of May, stocks began a correction that saw prices drop nearly 5%. The move followed on the heels of a drop in the percent of stocks trading above their 200 period moving averages nearly two weeks before. And although stocks have been working higher, volume has yet to confirm the move. Should these factors concern the bulls? |
|
| Figure 1 � Daily chart comparing the S&P500 Trust ETF (SPY) versus the % stocks trading above their 200 daily moving averages (DMA), a useful measure of market internal strength, since November 2012. |
| Graphic provided by: TC2000.com. |
| |
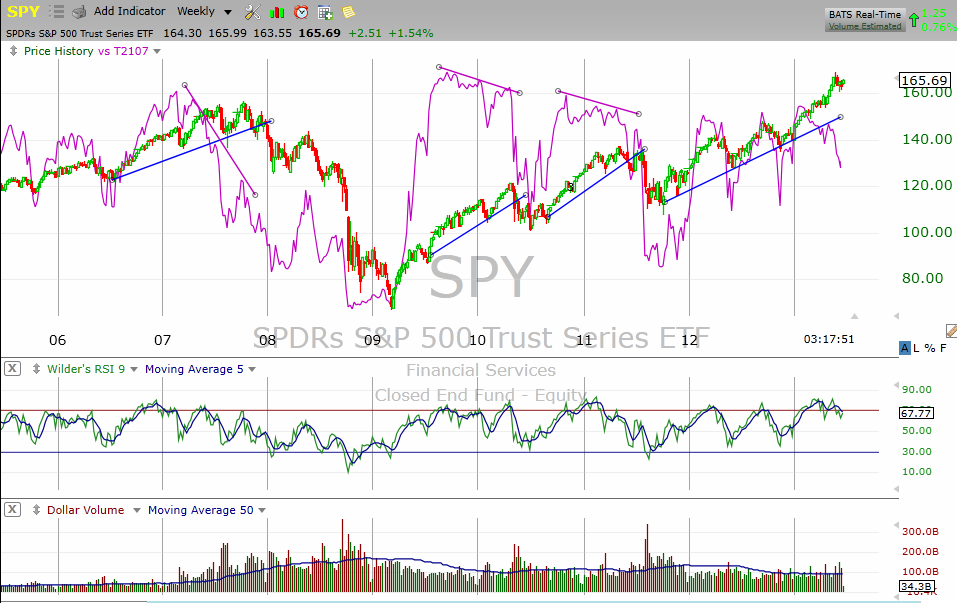
| To answer that question, it is valuable to look back a little further at the relationship between overall market internals (breadth) and SPY (Figure 1). As we see in the chart in Figure 2 showing the relationship on a weekly chart, market internals have usually dropped well in advance of a market correction. The first example occurred in early 2007 as market internals began to drop with a vengeance in January that year, nine months before stock prices in the broader market began to roll over. Similarly, market internals weakened months in advance of corrections in stocks in 2009-10 and in 2011-12. |
|
| Figure 2 � Weekly chart comparing the longer term relationship between the SPY and % stocks trading above their 200 DMA. |
| Graphic provided by: TC2000.com. |
| |
| As you can see from Figure 2, after peaking in early 2013, market internal strength has again diverged from stocks. Now the big question is when will stocks follow suit? |
| Volume has been weak since stocks bottomed in early June but that is less of a concern as it can also indicate slow buy accumulation. But unless we see market internals strengthen markedly in the coming weeks, another correction can't be too far behind. |
Matt Blackman is a full-time technical and financial writer and trader. He produces corporate and financial newsletters, and assists clients in getting published in the mainstream media. He is the host of TradeSystemGuru.com. Matt has earned the Chartered Market Technician (CMT) designation. Find out what stocks and futures Matt is watching on Twitter at www.twitter.com/RatioTrade
| Company: | TradeSystemGuru.com |
| Address: | Box 2589 |
| Garibaldi Highlands, BC Canada | |
| Phone # for sales: | 604-898-9069 |
| Fax: | 604-898-9069 |
| Website: | www.tradesystemguru.com |
| E-mail address: | indextradermb@gmail.com |
Traders' Resource Links | |
| TradeSystemGuru.com has not added any product or service information to TRADERS' RESOURCE. | |
Click here for more information about our publications!
PRINT THIS ARTICLE

Request Information From Our Sponsors
- StockCharts.com, Inc.
- Candle Patterns
- Candlestick Charting Explained
- Intermarket Technical Analysis
- John Murphy on Chart Analysis
- John Murphy's Chart Pattern Recognition
- John Murphy's Market Message
- MurphyExplainsMarketAnalysis-Intermarket Analysis
- MurphyExplainsMarketAnalysis-Visual Analysis
- StockCharts.com
- Technical Analysis of the Financial Markets
- The Visual Investor
- VectorVest, Inc.
- Executive Premier Workshop
- One-Day Options Course
- OptionsPro
- Retirement Income Workshop
- Sure-Fire Trading Systems (VectorVest, Inc.)
- Trading as a Business Workshop
- VectorVest 7 EOD
- VectorVest 7 RealTime/IntraDay
- VectorVest AutoTester
- VectorVest Educational Services
- VectorVest OnLine
- VectorVest Options Analyzer
- VectorVest ProGraphics v6.0
- VectorVest ProTrader 7
- VectorVest RealTime Derby Tool
- VectorVest Simulator
- VectorVest Variator
- VectorVest Watchdog