HOT TOPICS LIST
- MACD
- Fibonacci
- RSI
- Gann
- ADXR
- Stochastics
- Volume
- Triangles
- Futures
- Cycles
- Volatility
- ZIGZAG
- MESA
- Retracement
- Aroon
INDICATORS LIST
LIST OF TOPICS
PRINT THIS ARTICLE
by Koos van der Merwe
NetSuite runs all of your key back-office operations and financial business processes.
Position: Buy
Koos van der Merwe
Has been a technical analyst since 1969, and has worked as a futures and options trader with First Financial Futures in Johannesburg, South Africa.
PRINT THIS ARTICLE
CHART ANALYSIS
NetSuite
06/20/13 08:47:13 PMby Koos van der Merwe
NetSuite runs all of your key back-office operations and financial business processes.
Position: Buy
| NetSuite's financial management software solution is used by thousands of organizations to manage their accounting needs. The software provides strong expense management and offers streamlined and auditable revenue management ensuring complete real-time visibility into the financial performance of an entire business. The software is completely cloud-based and because of this, IT costs are reduced as well as complexity. You can gain access to critical information, and generate savings that on-premise software simply can't deliver anytime, anywhere. OK... so much for the advertising, but what do the charts tell us? |

|
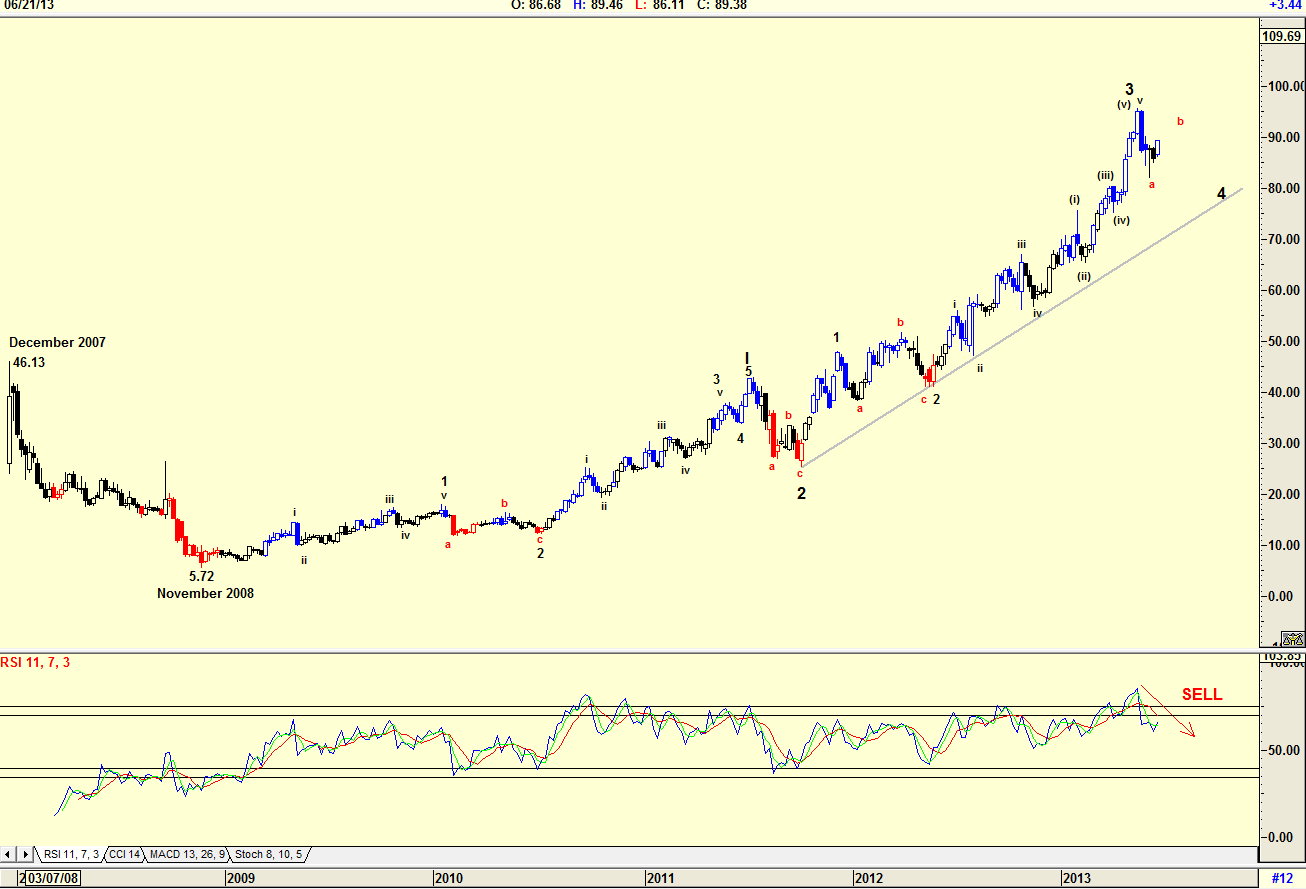
| Figure 1. Weekly chart with Elliott wave count. |
| Graphic provided by: AdvancedGET. |
| |
| The weekly chart in Figure 1 shows an Elliott wave count that suggests the share price is in a WAVE 4 correction. This is confirmed by the RSI indicator which is overbought and has given a sell signal. |

|
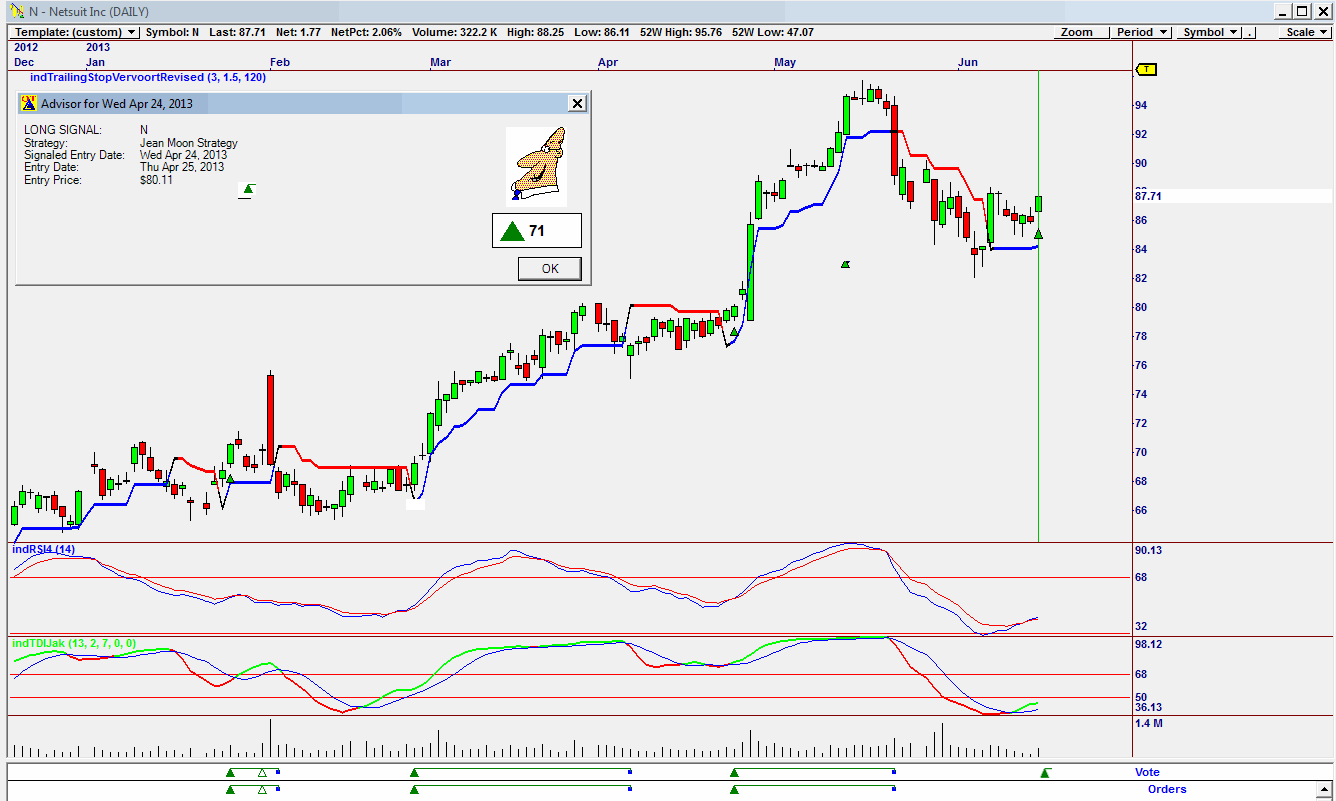
| Figure 2. Daily chart showing Jean Moon internal band buy signal. |
| Graphic provided by: Omnitrader. |
| |
| The daily chart in Figure 2 shows that the Jean Moon Internal Band strategy on the VOTE line has given a buy signal. The advisor rating is 71 which is a high rating. The Jean Moon Internal Band strategy (JM Internal Band) is a 15-period moving average offset by 2% positive and 2% negative. Do note that the RSI indicator and the TDI indicator have given buy signals. I would be a buyer of Netsuite at these levels, but with the weekly chart looking negative, I would keep my stops close. |
Has been a technical analyst since 1969, and has worked as a futures and options trader with First Financial Futures in Johannesburg, South Africa.
| Address: | 3256 West 24th Ave |
| Vancouver, BC | |
| Phone # for sales: | 6042634214 |
| E-mail address: | petroosp@gmail.com |
Click here for more information about our publications!
PRINT THIS ARTICLE

Request Information From Our Sponsors
- StockCharts.com, Inc.
- Candle Patterns
- Candlestick Charting Explained
- Intermarket Technical Analysis
- John Murphy on Chart Analysis
- John Murphy's Chart Pattern Recognition
- John Murphy's Market Message
- MurphyExplainsMarketAnalysis-Intermarket Analysis
- MurphyExplainsMarketAnalysis-Visual Analysis
- StockCharts.com
- Technical Analysis of the Financial Markets
- The Visual Investor
- VectorVest, Inc.
- Executive Premier Workshop
- One-Day Options Course
- OptionsPro
- Retirement Income Workshop
- Sure-Fire Trading Systems (VectorVest, Inc.)
- Trading as a Business Workshop
- VectorVest 7 EOD
- VectorVest 7 RealTime/IntraDay
- VectorVest AutoTester
- VectorVest Educational Services
- VectorVest OnLine
- VectorVest Options Analyzer
- VectorVest ProGraphics v6.0
- VectorVest ProTrader 7
- VectorVest RealTime Derby Tool
- VectorVest Simulator
- VectorVest Variator
- VectorVest Watchdog
