HOT TOPICS LIST
- MACD
- Fibonacci
- RSI
- Gann
- ADXR
- Stochastics
- Volume
- Triangles
- Futures
- Cycles
- Volatility
- ZIGZAG
- MESA
- Retracement
- Aroon
INDICATORS LIST
LIST OF TOPICS
PRINT THIS ARTICLE
by David Penn
Is there finally a reason to fear the bull market in the 10-year Treasury note?
Position: N/A
David Penn
Technical Writer for Technical Analysis of STOCKS & COMMODITIES magazine, Working-Money.com, and Traders.com Advantage.
PRINT THIS ARTICLE
TRIANGLES
The Triangle in Treasuries
09/03/02 03:14:50 PMby David Penn
Is there finally a reason to fear the bull market in the 10-year Treasury note?
Position: N/A
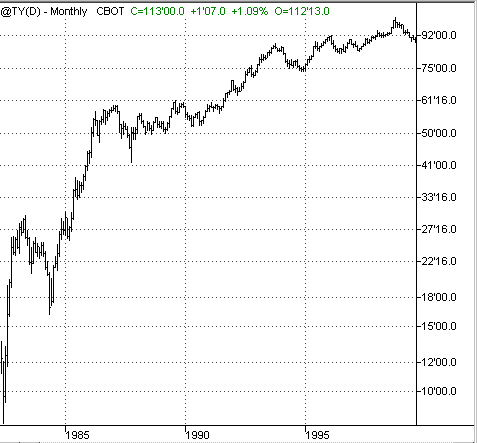
| One of the more remarkable aspects of the secular bull market in equities that ended in 2000 was the secular bull market in bonds--particularly government bonds such as the 10-year Treasury. James Grant noted in his classic text on the history of lending in America, Money of the Mind, that "from 1946 to 1981, the government was a chronic issuer of depreciating bonds. Year by year, interest rates rose and (to say the same thing) bond prices fell. This state of affairs seemed to cause the governments of that period no moral distress." |
| Grant was referring specifically to the national political leadership at the beginning of the 20th century, a leadership reflected in then Republican president William H. Taft, who believed that the government has a responsibility to the bondholders (in his case, the national banks) to maintain the market value of the bonds. But he might as well have been referring to the national political leadership from 1982 to present, which has been more munificent toward government bondholders than President Taft would have ever dreamed of. |

|
| Figure 1: This chart shows the beginning of the secular bull market in the 10-year Treasury note in the early 1980s and into the 1990s. |
| Graphic provided by: TradeStation. |
| |
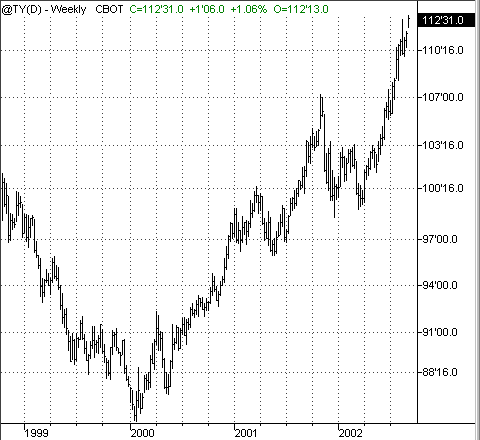
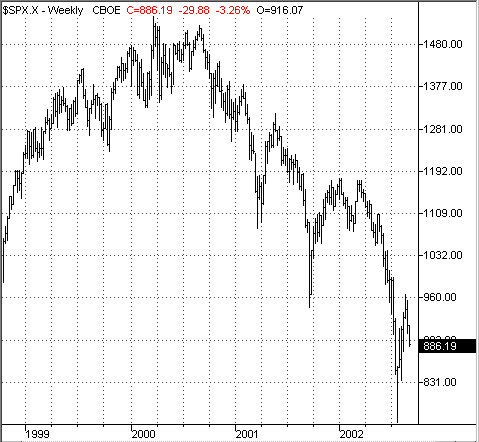
| Traditional intermarket technical analysis (the work of John Murphy, for example) suggests that stock prices tend to follow bond prices. As bond yields go down, bond prices go up, the cost of borrowing goes down, companies' balance sheets improve and their stock prices rise--goes the theory, broadly speaking. However, in an article for Working Money, I re-introducted the idea of Gibson's Paradox, which suggests that in a deflationary economic environment such as the present one, an environment characterized by overcapacity, too much indebtedness and a subsequent credit crunch, bond prices and stock prices might actually move in opposite directions. This is exactly what began happening in 1999, as the 10-year Treasury began to turn down while the stock market, as characterized by the S&P 500, spent one more year climbing. But as the S&P 500 peaked, the 10-year Treasury bottomed and rebounded. In fact, since 2000, stocks and government bonds have moved in strictly opposite directions, as the charts below show: |
 Figure 2a: The 10-year Treasury since 1999. Compare with the S&P 500 since 1999 and note how the two move in opposite directions.  Figure 2b: The S&P 500 since 1999. This has led to much conversation about the "impending" bond market peak. The new reality of bonds and stocks moving in opposite directions(call it the Gibson Paradox or not) has led most to conclude that the stock market will not rebound until the bond market breaks. Here, the thinking is that money that would otherwise be going into stocks is taking a risk-averse detour into the bond market. Thus, when the bond market breaks, it may represent a shift in investor preference away from fixed income securities and toward equities. The problem with this waiting-for-the-bonds-to-break approach, at this point, is straightforward: the bond market isn't breaking--at least not government bonds, which set a new all-time high in the fall of 2001 and now, one year later, look ready to set still yet another all-time high in the fall of 2002. |
 Figure 3: The September 10-year Treasury notes' triangle breakout looks to set a new high. The 10-year Treasury rally has been most impressive since the spring of 2002, when it tested an intermediate low at the beginning of the year. Since mid-March, the September 10-year Treasury, for example, has climbed from 100.80 to over 114. What is currently propelling the September T-note from a technical perspective is an August triangle that stretches from about 111 to 114. If the present breakout holds, then the September T-note could reach 116 in its next advance. This target is calculated by adding the formation size of three to the value at the breakout point, which appears to be about 113. |
Technical Writer for Technical Analysis of STOCKS & COMMODITIES magazine, Working-Money.com, and Traders.com Advantage.
| Title: | Technical Writer |
| Company: | Technical Analysis, Inc. |
| Address: | 4757 California Avenue SW |
| Seattle, WA 98116 | |
| Phone # for sales: | 206 938 0570 |
| Fax: | 206 938 1307 |
| Website: | www.Traders.com |
| E-mail address: | DPenn@traders.com |
Traders' Resource Links | |
| Charting the Stock Market: The Wyckoff Method -- Books | |
| Working-Money.com -- Online Trading Services | |
| Traders.com Advantage -- Online Trading Services | |
| Technical Analysis of Stocks & Commodities -- Publications and Newsletters | |
| Working Money, at Working-Money.com -- Publications and Newsletters | |
| Traders.com Advantage -- Publications and Newsletters | |
| Professional Traders Starter Kit -- Software | |
Click here for more information about our publications!
Comments
Date: 09/10/02Rank: 5Comment:

Request Information From Our Sponsors
- VectorVest, Inc.
- Executive Premier Workshop
- One-Day Options Course
- OptionsPro
- Retirement Income Workshop
- Sure-Fire Trading Systems (VectorVest, Inc.)
- Trading as a Business Workshop
- VectorVest 7 EOD
- VectorVest 7 RealTime/IntraDay
- VectorVest AutoTester
- VectorVest Educational Services
- VectorVest OnLine
- VectorVest Options Analyzer
- VectorVest ProGraphics v6.0
- VectorVest ProTrader 7
- VectorVest RealTime Derby Tool
- VectorVest Simulator
- VectorVest Variator
- VectorVest Watchdog
- StockCharts.com, Inc.
- Candle Patterns
- Candlestick Charting Explained
- Intermarket Technical Analysis
- John Murphy on Chart Analysis
- John Murphy's Chart Pattern Recognition
- John Murphy's Market Message
- MurphyExplainsMarketAnalysis-Intermarket Analysis
- MurphyExplainsMarketAnalysis-Visual Analysis
- StockCharts.com
- Technical Analysis of the Financial Markets
- The Visual Investor
