

HOT TOPICS LIST
- MACD
- Fibonacci
- RSI
- Gann
- ADXR
- Stochastics
- Volume
- Triangles
- Futures
- Cycles
- Volatility
- ZIGZAG
- MESA
- Retracement
- Aroon
INDICATORS LIST
LIST OF TOPICS
PRINT THIS ARTICLE
by Donald W. Pendergast, Jr.
Down by more than 40% since late October 2013, shares of Peabody Energy may now be under accumulation.
Position: N/A
Donald W. Pendergast, Jr.
Freelance financial markets writer and online publisher of the Trendzetterz.com S&P 500 Weekly Forecast service.
PRINT THIS ARTICLE
CHART ANALYSIS
Peabody Energy: Bullish Money Flow Divergence
06/18/13 04:02:26 PMby Donald W. Pendergast, Jr.
Down by more than 40% since late October 2013, shares of Peabody Energy may now be under accumulation.
Position: N/A
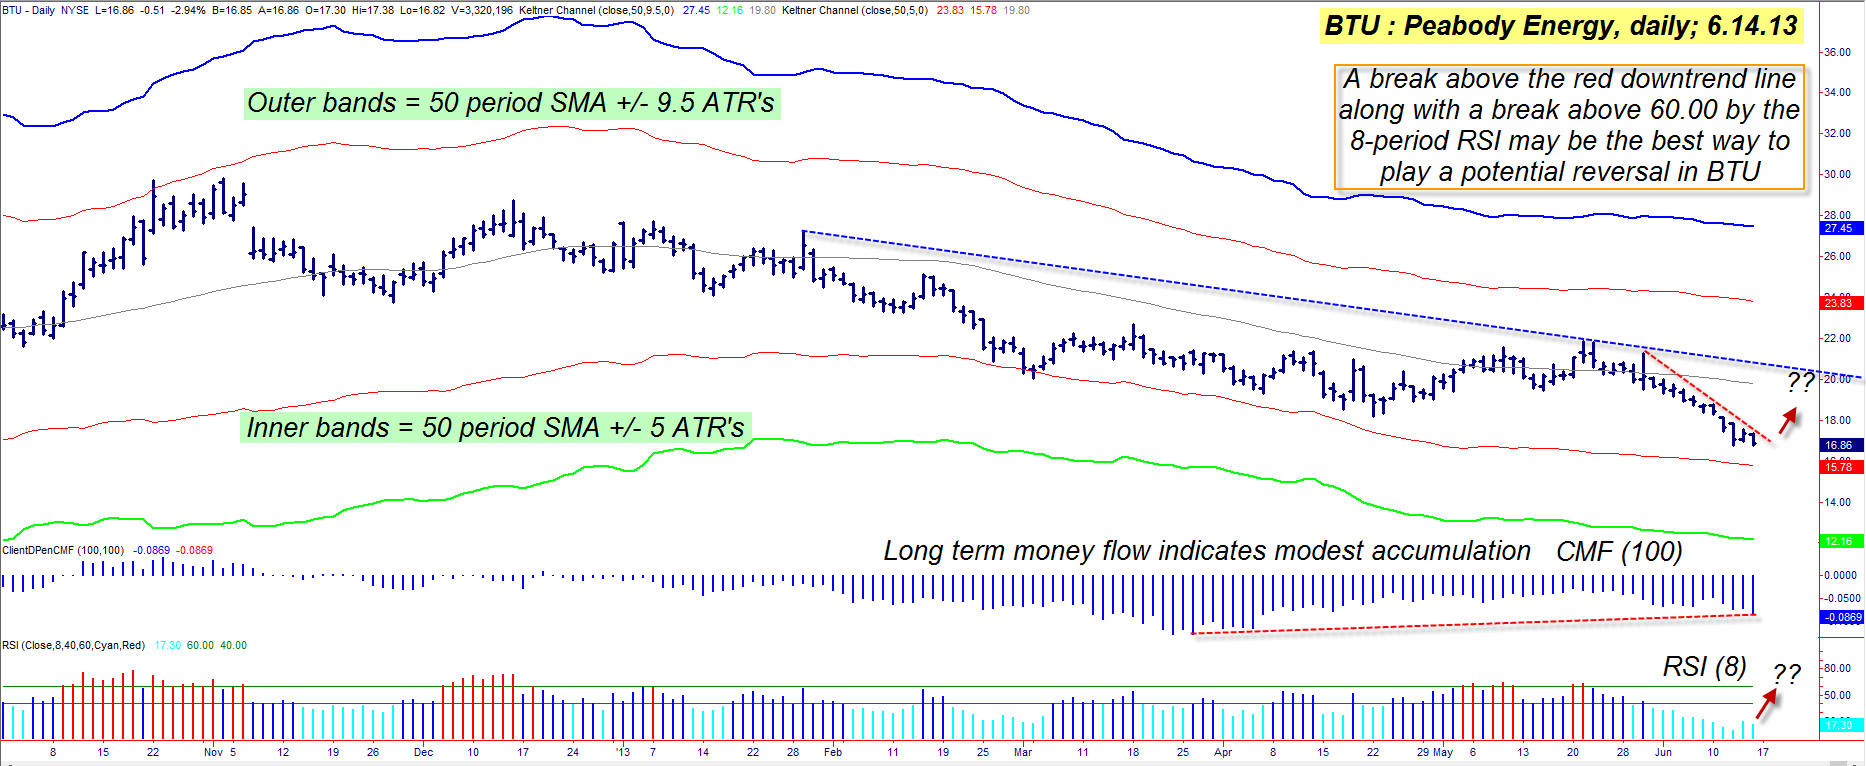
| The past eight months have not been very kind to long-term shareholders in Peabody Energy (BTU); the stock has been in a steady, relatively low volatility downtrend, staying well within the boundary formed by its two innermost Keltner bands (set at five average true ranges (ATR) away from a 50-period simple moving average (SMA)). And while a nearly 44% percent decline in such a modest amount of time would seem to be more than enough bad news to scare away prospective buyers, one key technical indicator appears to be confirming that the "smart money" may already be at work, slowly building up a new long position in anticipation of BYU's next rally. Here's a closer look. |
|
| Figure 1: With some accumulation already underway, savvy traders will be anticipating a bullish trend line break and/or RSI(8) break to confirm that BTU has indeed completed a major multicycle low. |
| Graphic provided by: TradeStation. |
| |
| The coal industry has certainly had to work hard on its public relations/public image issues over the years, particularly since the concept of global warming became a generally accepted belief by large numbers of people around the globe. Whether or not that belief has had a direct bearing on BTU's latest decline may be hard to prove, but it's certainly possible that it has been a factor. To long-term institutional investors, however, it's likely that they are more concerned with profitable quarterly results for their mutual fund clients than they are with the planet's ever-changing weather and climate patterns. And given that BTU's long-term money flow trend – based on the 100-day Chaikin Money flow histogram (CMF)(100) – now shows that at least some accumulation is underway, savvy traders need to start looking for a potential bullish breakout in this key energy sector stock. Note that although BTU has just made a new eight-month low, the money flow histogram just made a higher low and the eight-period RSI is also ticking higher. These are both strong clues that the selling pressures are abating – to some degree – and that some sort of institutional buying is coming to the rescue. |
|
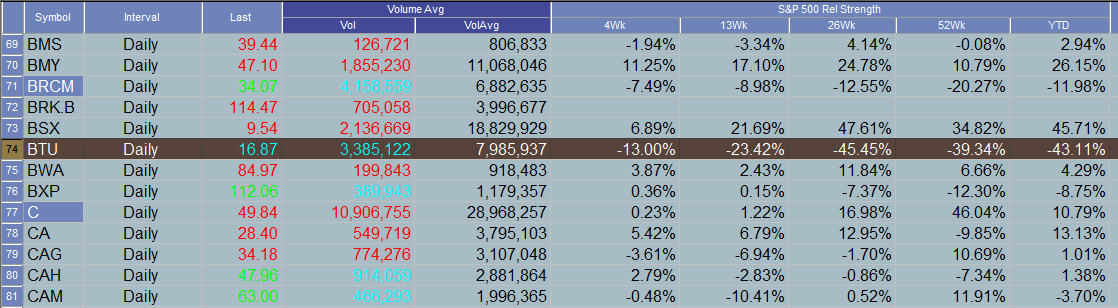
| Figure 2: BTU has been significantly underperforming the S&P 500 index (.SPX) over the past 4-, 13-, 26- and 52-week periods. |
| Graphic provided by: TradeStation. |
| Graphic provided by: TradeStation Radar Screen. |
| |
| Cycle studies also reveal that BTU is at/near a time window for a major multicycle low to form in BTU. However, since the only way to confirm a valid cycle low is for a meaningful reversal to confirm it (sometimes a week or two after the ultimate low), attempting to predict or call an exact low is usually an exercise in frustration. But if you look on the chart in Figure 1 you'll find two simple, easy to use tools that can help make entering a post-reversal trade a bit less stressful: 1. Plotting a valid trend line (this one starts at the prior swing high) after a sustained multiday swing move can help alert you to a potential break higher (lower). 2. Using the eight-period RSI (try a six-period for more signals and a 10 or 12-period RSI for fewer signals) with overbought/oversold levels of 60/40 can also alert you to a potentially valid breakout move. And when both the trend line and RSI are confirming a breakout, the signal may be worth a closer look. As this is written, the eight-day RSI is at 16.58 and the big idea is to wait for it to make a daily close above 60.00, entering a new long position at the next session's open. Once in the trade (assuming it triggers as anticipated) consider running a five to nine-day SMA as your trailing stop to manage the position, being aware that BTU's next significant resistance area is near the 20.00 area, with the Keltner mid-line (thin gray line near 19.80) also a potential hindrance to a new rally attempt. Over the near term, BTU's chances of a rally up to at least 20.00 are very good, but be aware that after such a long decline a double bottom may need to form before BTU can even begin to mount a sustained, multi-week/multi-month rally. As a reversal-style swing trade, try not to risk more than 1% of your account value on this trade and remember to trade and invest wisely until we meet again. |
Freelance financial markets writer and online publisher of the Trendzetterz.com S&P 500 Weekly Forecast service.
| Title: | Market consultant and writer |
| Company: | Trendzetterz |
| Address: | 81 Hickory Hollow Drive |
| Crossville, TN 38555 | |
| Phone # for sales: | 904-303-4814 |
| Website: | trendzetterz.com |
| E-mail address: | support@trendzetterz.com |
Traders' Resource Links | |
| Trendzetterz has not added any product or service information to TRADERS' RESOURCE. | |
Click here for more information about our publications!
PRINT THIS ARTICLE

Request Information From Our Sponsors
- StockCharts.com, Inc.
- Candle Patterns
- Candlestick Charting Explained
- Intermarket Technical Analysis
- John Murphy on Chart Analysis
- John Murphy's Chart Pattern Recognition
- John Murphy's Market Message
- MurphyExplainsMarketAnalysis-Intermarket Analysis
- MurphyExplainsMarketAnalysis-Visual Analysis
- StockCharts.com
- Technical Analysis of the Financial Markets
- The Visual Investor
- VectorVest, Inc.
- Executive Premier Workshop
- One-Day Options Course
- OptionsPro
- Retirement Income Workshop
- Sure-Fire Trading Systems (VectorVest, Inc.)
- Trading as a Business Workshop
- VectorVest 7 EOD
- VectorVest 7 RealTime/IntraDay
- VectorVest AutoTester
- VectorVest Educational Services
- VectorVest OnLine
- VectorVest Options Analyzer
- VectorVest ProGraphics v6.0
- VectorVest ProTrader 7
- VectorVest RealTime Derby Tool
- VectorVest Simulator
- VectorVest Variator
- VectorVest Watchdog