

HOT TOPICS LIST
- MACD
- Fibonacci
- RSI
- Gann
- ADXR
- Stochastics
- Volume
- Triangles
- Futures
- Cycles
- Volatility
- ZIGZAG
- MESA
- Retracement
- Aroon
INDICATORS LIST
LIST OF TOPICS
PRINT THIS ARTICLE
by Donald W. Pendergast, Jr.
Shares of Eli Lilly are down by 11% over the past month but may get a bit of a bounce if a key support level holds up.
Position: N/A
Donald W. Pendergast, Jr.
Freelance financial markets writer and online publisher of the Trendzetterz.com S&P 500 Weekly Forecast service.
PRINT THIS ARTICLE
SUPPORT & RESISTANCE
LLY: Nearing A Significant Support Zone?
06/17/13 03:10:19 PMby Donald W. Pendergast, Jr.
Shares of Eli Lilly are down by 11% over the past month but may get a bit of a bounce if a key support level holds up.
Position: N/A
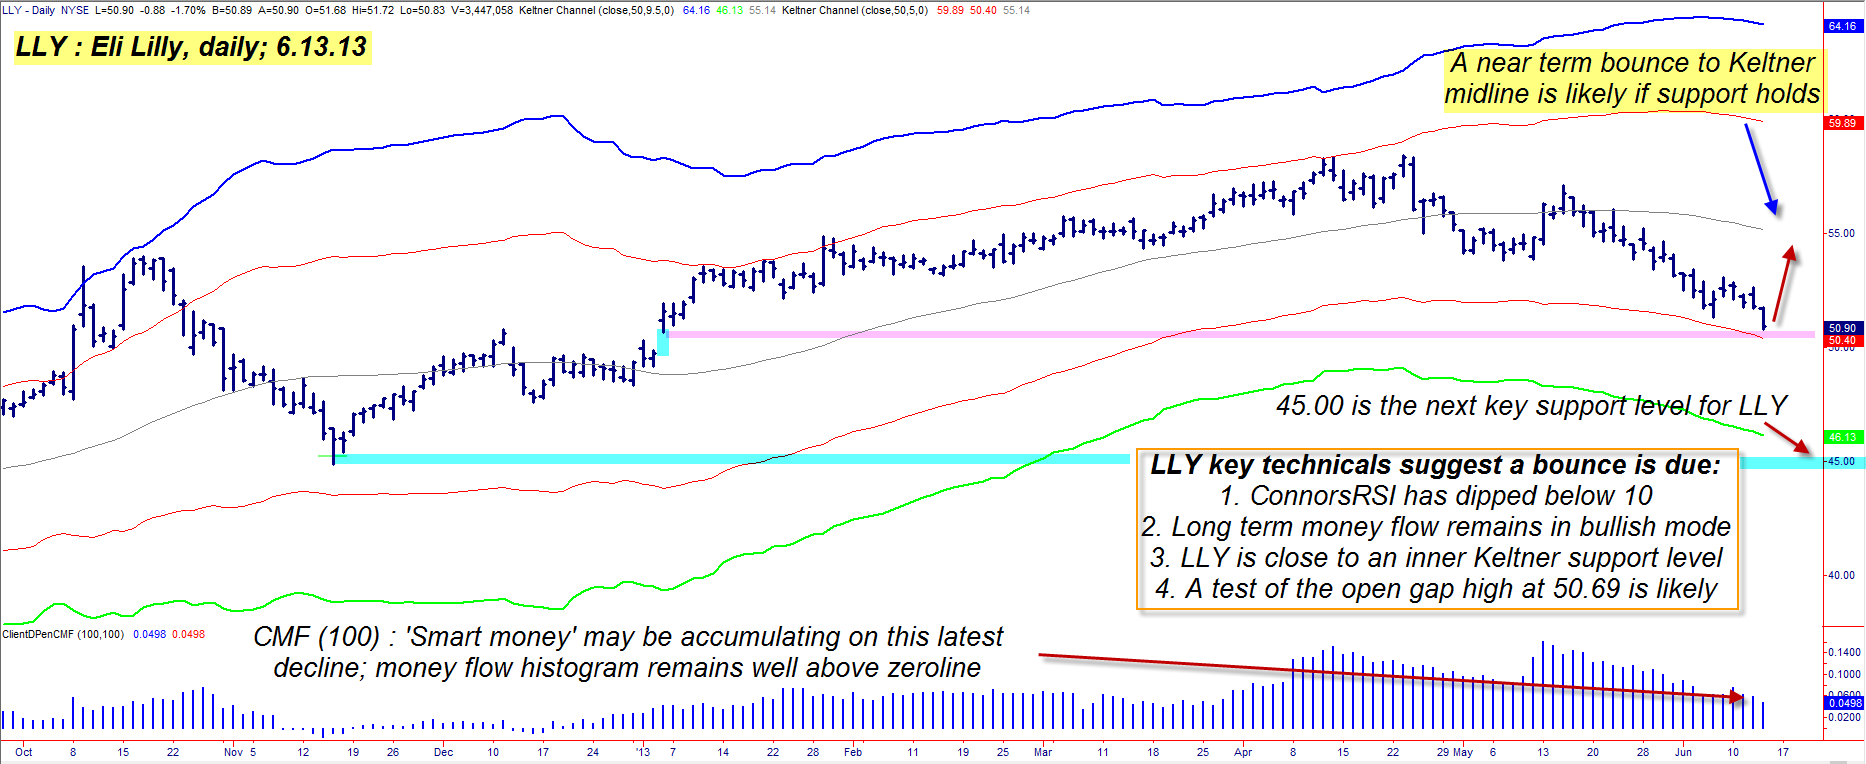
| Some large caps stocks are rather tame in terms of their ability to produce large percentage gains every time they embark on a sustained swing/trend move, but that they tend to move in fairly smooth, non-volatile thrusts makes them much easier to trade over long periods of time. Here's a look at a household "big pharma" name - Eli Lily (LLY) - a large cap that looks like its getting ready for some sort of a bounce, now that is has approached an important support level (Figure 1). |
|
| Figure 1: Despite an 11% decline in LLY over the last month, the stock's long term bullish bias appears to be intact. There is a high probability for a bounce higher once the open gap area fills or is partially closed. |
| Graphic provided by: TradeStation. |
| |
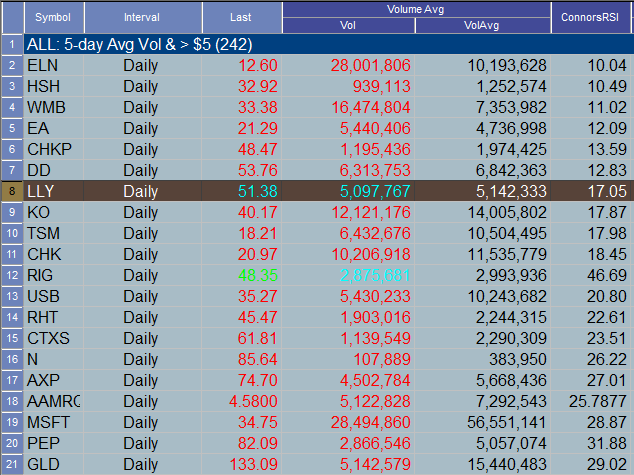
| LLY's latest major multicycle low occurred back on November 15, 2012, when it bottomed out at 44.88; the stock then proceeded to rise to 58.40 by April 23, 2013 - a slow, yet steady grind higher that was good for a 30% gain. Despite LLY's pullback from that high during the last seven weeks, the underlying bullish bias in this key health sector stock remains intact; for example: 1.LLY's long-term Chaikin Money flow histogram (CMF)(100) is still well above its zero line and is therefore in bullish territory. 2. The stock recently registered a ConnorsRSI (CRSI) daily closing value below 10.00 (Figure 2); this indicator can frequently be used to help identify stocks, ETFs, futures, and forex markets that are approaching key turning points. Readings below 10 or above 90 can be a big assist in helping get a trader prepared for such key turns. 3. LLY is now very close to one of its inner Keltner bands, one which may provide support. 4. LLY is also trading just above the still-open daily gap that printed on January 4, 2013; many times a stock will dip into and/or actually close a major open gap just before it reverses direction - sometimes in a big way. So, we have those four bullishly-biased dynamics at work on LLY's daily graph...and now what? Well, the thing to watch for is this - if LLY dips down into (or very near to) the top end of the open gap - at 50.70-50.80 - and then rapidly reverses higher during the same session, you may be witnessing a successful test of key support. But to actually trigger a new long entry signal, you'll need to see LLY's last minor swing high of 52.61 exceeded; once that happens, you have a high-probability reversal underway. |
|
| Figure 2: Stocks that feature a daily ConnorsRSI closing value lower than 10 or higher than 90 may be approaching short-term reversal areas; LLY's prior day ConnorsRSI closing value was actually below 10. |
| Graphic provided by: TradeStation. |
| Graphic provided by: TradeStation Radar Screen. |
| |
| If/when 52.61 is exceeded, consider the following bullish put option play: 1. As 52.61 is broken to the upside, sell the July '13 LLY $49.00 put option; the bid/ask spread is about a nickel and the daily time decay factor (theta) is $2 per day/per contract. Open interest on this put is 688 contracts. 2. LLY's next post-breakout resistance level is near the 55.00 area (the Keltner midline) and that will be your extreme price target area for this reversal move; anything above 54.00, however, might be a great place to take at least half profits off the table. 3. Apart from those price target zones, also consider profit taking if the put declines in value by 50 to 60% or if it increases in value by 80 to 100%. Additionally, if you see LLY dip back below 50.25, just buy back the put and take a modest loss. |
| Since this is a reversal-style trade setup, try not to risk more than 1% of your account value on it. Trade wisely until we meet here again. |
Freelance financial markets writer and online publisher of the Trendzetterz.com S&P 500 Weekly Forecast service.
| Title: | Market consultant and writer |
| Company: | Trendzetterz |
| Address: | 81 Hickory Hollow Drive |
| Crossville, TN 38555 | |
| Phone # for sales: | 904-303-4814 |
| Website: | trendzetterz.com |
| E-mail address: | support@trendzetterz.com |
Traders' Resource Links | |
| Trendzetterz has not added any product or service information to TRADERS' RESOURCE. | |
Click here for more information about our publications!
Comments

Request Information From Our Sponsors
- StockCharts.com, Inc.
- Candle Patterns
- Candlestick Charting Explained
- Intermarket Technical Analysis
- John Murphy on Chart Analysis
- John Murphy's Chart Pattern Recognition
- John Murphy's Market Message
- MurphyExplainsMarketAnalysis-Intermarket Analysis
- MurphyExplainsMarketAnalysis-Visual Analysis
- StockCharts.com
- Technical Analysis of the Financial Markets
- The Visual Investor
- VectorVest, Inc.
- Executive Premier Workshop
- One-Day Options Course
- OptionsPro
- Retirement Income Workshop
- Sure-Fire Trading Systems (VectorVest, Inc.)
- Trading as a Business Workshop
- VectorVest 7 EOD
- VectorVest 7 RealTime/IntraDay
- VectorVest AutoTester
- VectorVest Educational Services
- VectorVest OnLine
- VectorVest Options Analyzer
- VectorVest ProGraphics v6.0
- VectorVest ProTrader 7
- VectorVest RealTime Derby Tool
- VectorVest Simulator
- VectorVest Variator
- VectorVest Watchdog