HOT TOPICS LIST
- MACD
- Fibonacci
- RSI
- Gann
- ADXR
- Stochastics
- Volume
- Triangles
- Futures
- Cycles
- Volatility
- ZIGZAG
- MESA
- Retracement
- Aroon
INDICATORS LIST
LIST OF TOPICS
PRINT THIS ARTICLE
by Chaitali Mohile
Will CA Inc. breach historical resistance and undergo a bullish breakout?
Position: N/A
Chaitali Mohile
Active trader in the Indian stock markets since 2003 and a full-time writer. Trading is largely based upon technical analysis.
PRINT THIS ARTICLE
BREAKOUTS
CA Hits Robust Resistance
06/14/13 04:34:46 PMby Chaitali Mohile
Will CA Inc. breach historical resistance and undergo a bullish breakout?
Position: N/A
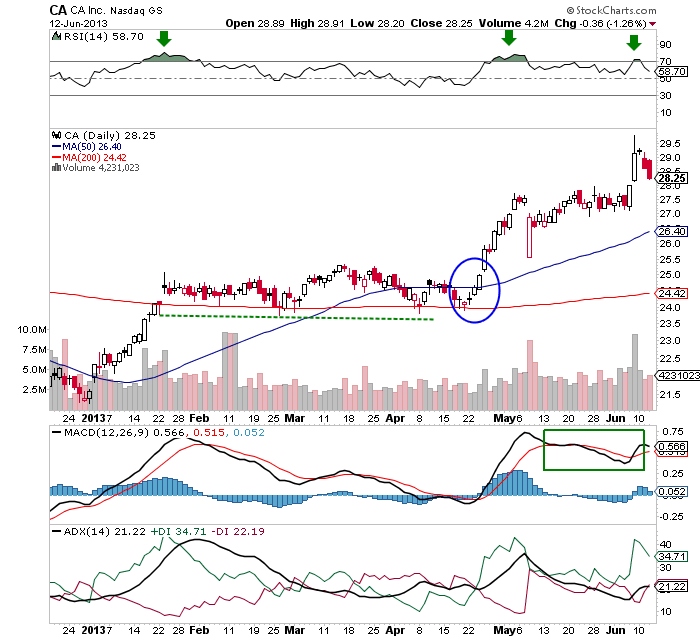
| In early 2013, CA Inc (CA) breached its 200-day moving average (MA) resistance and consolidated for almost two months with the newly formed support. The sideways action accumulated bullish strength for the future rally. We can see in Figure 1 that the stock consolidated due to an overheated uptrend indicated by the average directional index (ADX(14)). The plunging trend indicator induced volatility in the horizontal rally; however, the stable 200-day MA support was the positive sign for CA. The relative strength index (RSI(14)) also drifted from the healthy overbought region. The indicator marked the resistance at 70 levels. |

|
| Figure 1. Daily chart of CA. |
| Graphic provided by: StockCharts.com. |
| |
| Meanwhile, the 50-day moving average (MA) surged above the 200-day MA, highlighting a bullish moving average breakout. This added strength to the bullish breakout in late April 2013. The MA breakout generated new buying sentiments, and as a result, the volume increased throughout the rally. The ADX (14) surged above the 20 level with huge buying pressure, developing a fresh uptrend for CA. The declining moving average convergence/divergence (MACD(12,26,9)) established support at the zero line and moved vertically upwards, indicating a developing bullish momentum. Everything together pulled CA higher at 29.5 levels. The two small gaps formed during the rally were filled immediately. Hence, there is no threat to the rally. However, RSI(14) should be observed closely as it has failed to breach resistance at the 70 level and the ADX(14) should sustain above the 20 levels with robust buying pressure. |
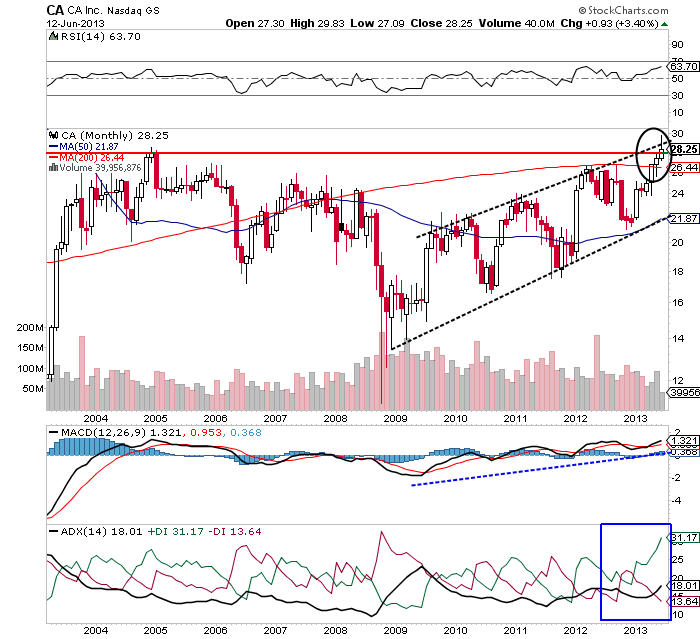
| Recently, this breakout rally has hit historical resistance at $28.25 on its monthly time frame in Figure 2. CA began its bullish journey in 2009 from $12. During the process, the rally formed higher highs and lows, forming an ascending channel. The stock moved within the channel, rallying higher and higher. The two trendlines were challenged at regular intervals. All the upward moves initiated from the lower trendline support were suspended by the upper trendline resistance. Therefore, the rallies in both directions provided trading opportunities with accurate stop-losses at the trendlines. |

|
| Figure 2. Monthly chart of CA. |
| Graphic provided by: StockCharts.com. |
| |
| However, the upward price action that began in early 2013 is likely to breach the upper trendline resistance and trigger a new bullish breakout. To undergo the trendline breakout, CA has to violate another robust resistance of the previous high (2005) at $28.25. Since both resistances are pretty strong, the breakout is likely to be slow. |
| In addition, the ADX(14) has not developed an uptrend though the buying pressure is high, and the MACD(12,26,9) is very volatile. The RSI(14) is steadily moving upwards in an overbought region. Due to these mixed views, it will be difficult to make any current trading decision. However, the ascending RSI(14), high buying pressure, and expanding volume is likely to likelihood of a bullish breakout. But we need to wait for the strong and confirmed signs, such as the price rally has to sustain near or above the resistance line, and the uptrend has to develop. The stock could consolidate at current levels. Hence, CA could be one of the stocks to be observed carefully for trading opportunities. |
Active trader in the Indian stock markets since 2003 and a full-time writer. Trading is largely based upon technical analysis.
| Company: | Independent |
| Address: | C1/3 Parth Indraprasth Towers. Vastrapur |
| Ahmedabad, Guj 380015 | |
| E-mail address: | chaitalimohile@yahoo.co.in |
Traders' Resource Links | |
| Independent has not added any product or service information to TRADERS' RESOURCE. | |
Click here for more information about our publications!
PRINT THIS ARTICLE

Request Information From Our Sponsors
- StockCharts.com, Inc.
- Candle Patterns
- Candlestick Charting Explained
- Intermarket Technical Analysis
- John Murphy on Chart Analysis
- John Murphy's Chart Pattern Recognition
- John Murphy's Market Message
- MurphyExplainsMarketAnalysis-Intermarket Analysis
- MurphyExplainsMarketAnalysis-Visual Analysis
- StockCharts.com
- Technical Analysis of the Financial Markets
- The Visual Investor
- VectorVest, Inc.
- Executive Premier Workshop
- One-Day Options Course
- OptionsPro
- Retirement Income Workshop
- Sure-Fire Trading Systems (VectorVest, Inc.)
- Trading as a Business Workshop
- VectorVest 7 EOD
- VectorVest 7 RealTime/IntraDay
- VectorVest AutoTester
- VectorVest Educational Services
- VectorVest OnLine
- VectorVest Options Analyzer
- VectorVest ProGraphics v6.0
- VectorVest ProTrader 7
- VectorVest RealTime Derby Tool
- VectorVest Simulator
- VectorVest Variator
- VectorVest Watchdog
