

HOT TOPICS LIST
- MACD
- Fibonacci
- RSI
- Gann
- ADXR
- Stochastics
- Volume
- Triangles
- Futures
- Cycles
- Volatility
- ZIGZAG
- MESA
- Retracement
- Aroon
INDICATORS LIST
LIST OF TOPICS
PRINT THIS ARTICLE
by Donald W. Pendergast, Jr.
Shares of YRC Worldwide, Inc. have been surging higher since staging a major breakout six weeks ago.
Position: N/A
Donald W. Pendergast, Jr.
Freelance financial markets writer and online publisher of the Trendzetterz.com S&P 500 Weekly Forecast service.
PRINT THIS ARTICLE
KELTNER CHANNELS
YRCW: A Major Bull Run
06/13/13 04:41:02 PMby Donald W. Pendergast, Jr.
Shares of YRC Worldwide, Inc. have been surging higher since staging a major breakout six weeks ago.
Position: N/A
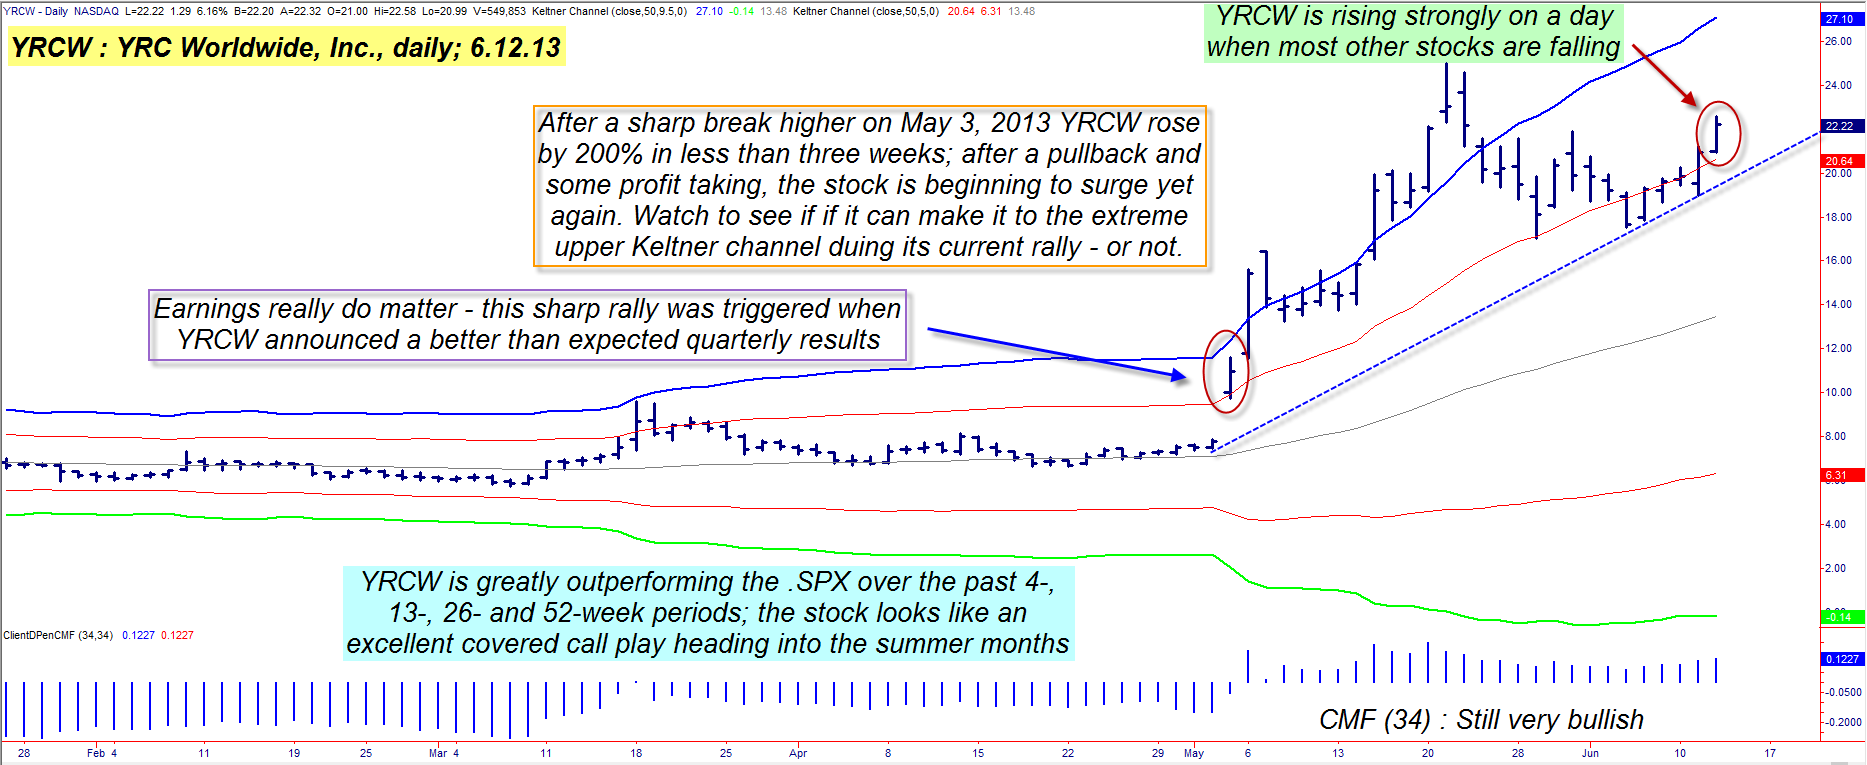
| Take a good look at the daily chart for YRC Worldwide, Inc. (YRCW)(Figure 1); it's obvious that the stock is in a major bull run, one that got going with a vengeance in early May 2013. What's not so obvious is that this giant trucking/transportation firm is still losing money – just at a slower rate than during some of its most recent fiscal quarters. On May 3, 2013, YRCW reported (before the market open) a quarterly loss of $3.46 per share as compared with a loss of $6.22 for the previous quarter and the market responded by doubling YRCW's share price – and in less than three weeks. Naturally, short-term profit takers cashed in on some of those fast gains, causing the stock to pull back to an inner Keltner band, but YRCW is once again sailing higher, drawing in new waves of buyers to help keep its rally aloft. Can this run continue? If so, what might be the lowest-risk way to play YRCW while it's still so red-hot? Here's a closer look. |
|
| Figure 1: YRCW continues to rally nearly three weeks after its latest earnings release initiated a powerful bullish breakout; the stock tripled in less than three weeks. |
| Graphic provided by: TradeStation. |
| |
| The daily chart shown in Figure 1 uses two sets of Keltner channels set up as follows: 1. The inner bands are set at five average true ranges (ATRs) away from a 50-period moving average. 2. The outer bands are set at 9.5 ATRs away from the same 50-period moving average. As with most other liquid, freely traded stocks, YRCW spends most of its time trading in the price range defined by the inner set of bands; moves higher or lower than this core range are typically precursors of powerful trending phases in the stock. When YRCW powered up and out of this inner Keltner range on May 3rd 2013, it wasted little time running up to – and then exceeding – its extreme upper band, thus confirming that traders and investors were still favorably impressed with the stock's earnings growth potential (or perhaps with the fact that it should lose less money going forward). Medium-term money flow remains very bullish; the 34-period Chaikin Money flow histogram (CMF)(34) is well above its zero line, implying that the "smart money" holders in this stock are not yet ready to sell out to lesser-informed market participants – at least not yet. In fact, it appears that all "systems" are a "go" for YRCW to make another run toward the extreme upper Keltner channel, now that the initial profit taking pullback is a done deal. That's because there's always an interest – by those who missed the first stage of the rally – in getting aboard the second wave up in a bullish stock that has already made a successful test of support. The probabilities are quite good for YRCW to rally throughout the remainder of June and into early July 2013, and a near-term covered call or swing trade may be the least risky way to take advantage of this current strength in YRCW. |
|
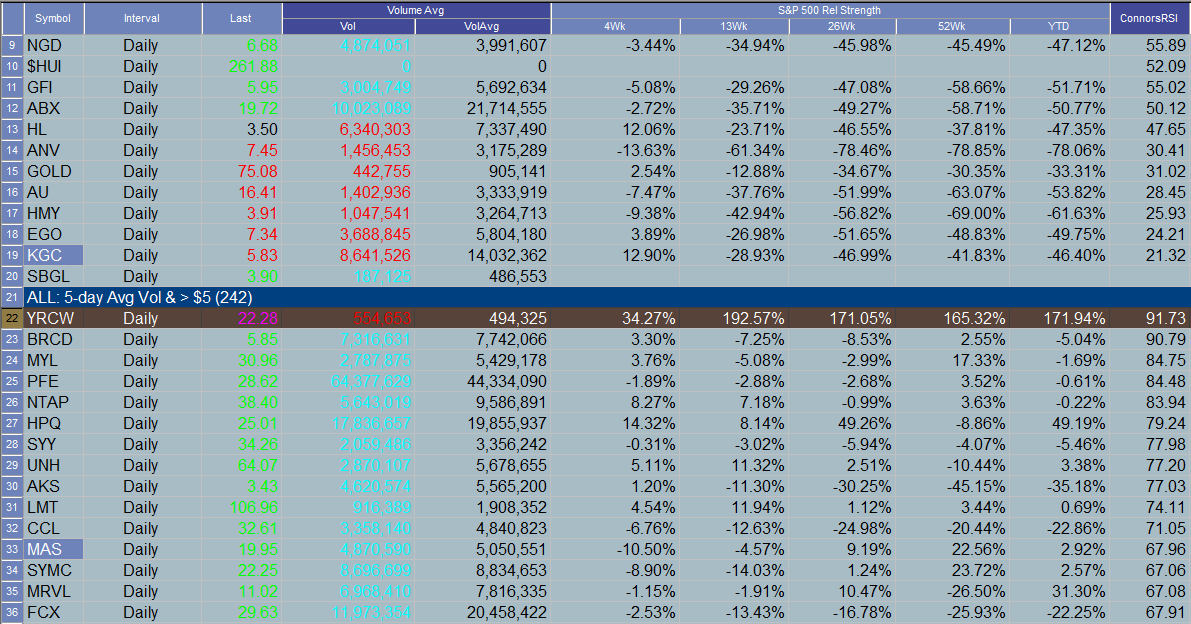
| Figure 2: YRCW has decimated the S&P 500 index (.SPX) in terms of comparative relative strength over the last 4-, 13-, 26- and 52-week periods. |
| Graphic provided by: TradeStation. |
| Graphic provided by: TradeStation Radar Screen. |
| |
| Calls and put bid/ask spreads in YRCW aren't exactly great, but if you are a skilled covered call trader, you may want to check out the July '13 $20 calls anyway. Open interest is 188 contracts and daily time decay is $3 per call/per day; if the stock is called away at expiration you stand to make about $110 per covered call (before commissions and slippage); this equates to a return of approximately 5.9% for a five week investment of capital. Be sure to use the blue dashed line as your trailing stop; a daily close below the line means that you liquidate the entire trade, no questions asked. Swing traders can also play YRCW by doing the following: 1. Wait to see if the stock pulls back to test 21.50 during the next trading session. 2. After a pullback to 21.50 or thereabouts, look to go long on a break back above 22.00 to 22.25 on a 30-minute chart and then use something like a five to nine-bar moving average as your trailing stop for the life of the trade. Overall, the probabilities would seem to favor more upside in YRCW for at least the next few weeks; watch the money flow histogram for signs of bearish divergence and/or distribution and also keep an eye out for the kind of price action that occurs if/when YRCW manages to meet/exceed the extreme upper Keltner band; that could be an area of great volatility, one where yet another correction might decide to manifest. Trade wisely until we meet again. |
Freelance financial markets writer and online publisher of the Trendzetterz.com S&P 500 Weekly Forecast service.
| Title: | Market consultant and writer |
| Company: | Trendzetterz |
| Address: | 81 Hickory Hollow Drive |
| Crossville, TN 38555 | |
| Phone # for sales: | 904-303-4814 |
| Website: | trendzetterz.com |
| E-mail address: | support@trendzetterz.com |
Traders' Resource Links | |
| Trendzetterz has not added any product or service information to TRADERS' RESOURCE. | |
Click here for more information about our publications!
PRINT THIS ARTICLE

Request Information From Our Sponsors
- StockCharts.com, Inc.
- Candle Patterns
- Candlestick Charting Explained
- Intermarket Technical Analysis
- John Murphy on Chart Analysis
- John Murphy's Chart Pattern Recognition
- John Murphy's Market Message
- MurphyExplainsMarketAnalysis-Intermarket Analysis
- MurphyExplainsMarketAnalysis-Visual Analysis
- StockCharts.com
- Technical Analysis of the Financial Markets
- The Visual Investor
- VectorVest, Inc.
- Executive Premier Workshop
- One-Day Options Course
- OptionsPro
- Retirement Income Workshop
- Sure-Fire Trading Systems (VectorVest, Inc.)
- Trading as a Business Workshop
- VectorVest 7 EOD
- VectorVest 7 RealTime/IntraDay
- VectorVest AutoTester
- VectorVest Educational Services
- VectorVest OnLine
- VectorVest Options Analyzer
- VectorVest ProGraphics v6.0
- VectorVest ProTrader 7
- VectorVest RealTime Derby Tool
- VectorVest Simulator
- VectorVest Variator
- VectorVest Watchdog