HOT TOPICS LIST
- MACD
- Fibonacci
- RSI
- Gann
- ADXR
- Stochastics
- Volume
- Triangles
- Futures
- Cycles
- Volatility
- ZIGZAG
- MESA
- Retracement
- Aroon
INDICATORS LIST
LIST OF TOPICS
PRINT THIS ARTICLE
by Koos van der Merwe
Rite Aid Corporation said today that it will release financial results for its Fiscal 2014 first quarter on Thursday, June 20, 2013.
Position: Buy
Koos van der Merwe
Has been a technical analyst since 1969, and has worked as a futures and options trader with First Financial Futures in Johannesburg, South Africa.
PRINT THIS ARTICLE
CHART ANALYSIS
Rite-Aid Corp.
06/12/13 02:45:58 PMby Koos van der Merwe
Rite Aid Corporation said today that it will release financial results for its Fiscal 2014 first quarter on Thursday, June 20, 2013.
Position: Buy
| Rite Aid is one of America's leading drugstore chains with more than 4,600 stores in 31 states and the District of Columbia with fiscal 2013 annual revenues of $24.4 billion. With Obamacare beginning to insert its influence in the medical and health industry in the US, what does the future hold for the company? |

|
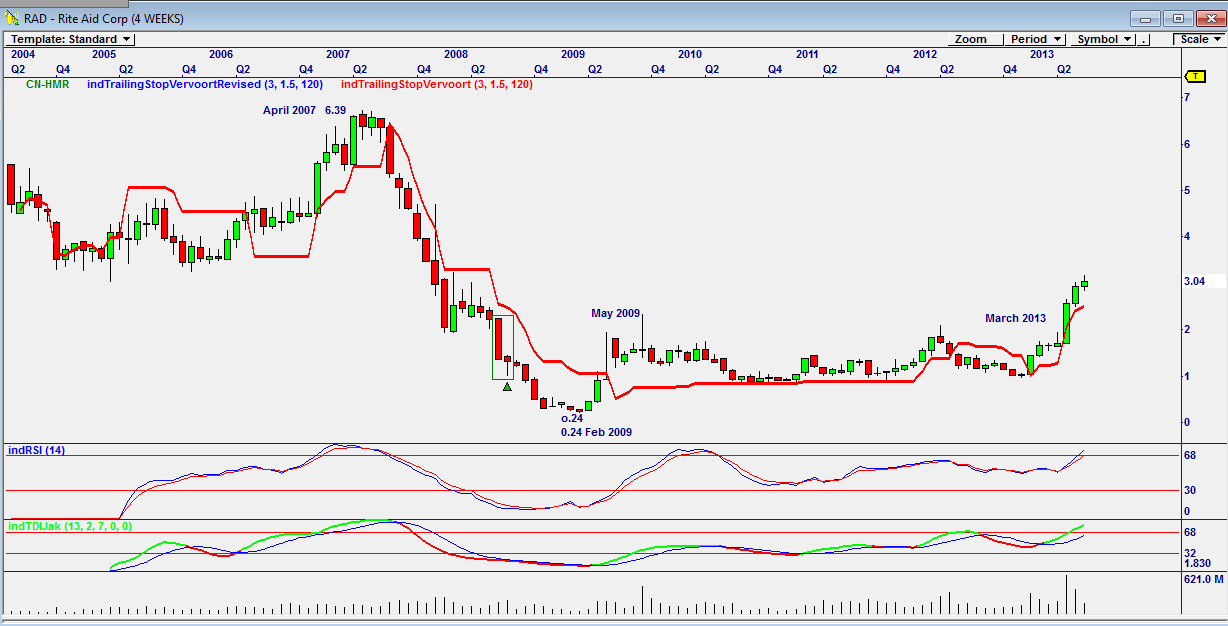
| Figure 1. Monthly chart of Rite Aid. |
| Graphic provided by: Omnitrader. |
| |
| The monthly chart in Figure 1 shows how the share price fell from a high of $6.39 in April 2007 to a low of 24 cents by February 2009. The price of the share then started recovering to its present price of $3.04. Was its recovery triggered by the election of President Obama and his Affordable Care Act? This is debatable, but the coincidence seems something to always keep in mind. The chart does show that the share price moved sideways from May 2009 to March 2013. Both the RSI indicator and the TDI indicator appear to be overbought. Also note how volume has fallen as the price rose. |

|
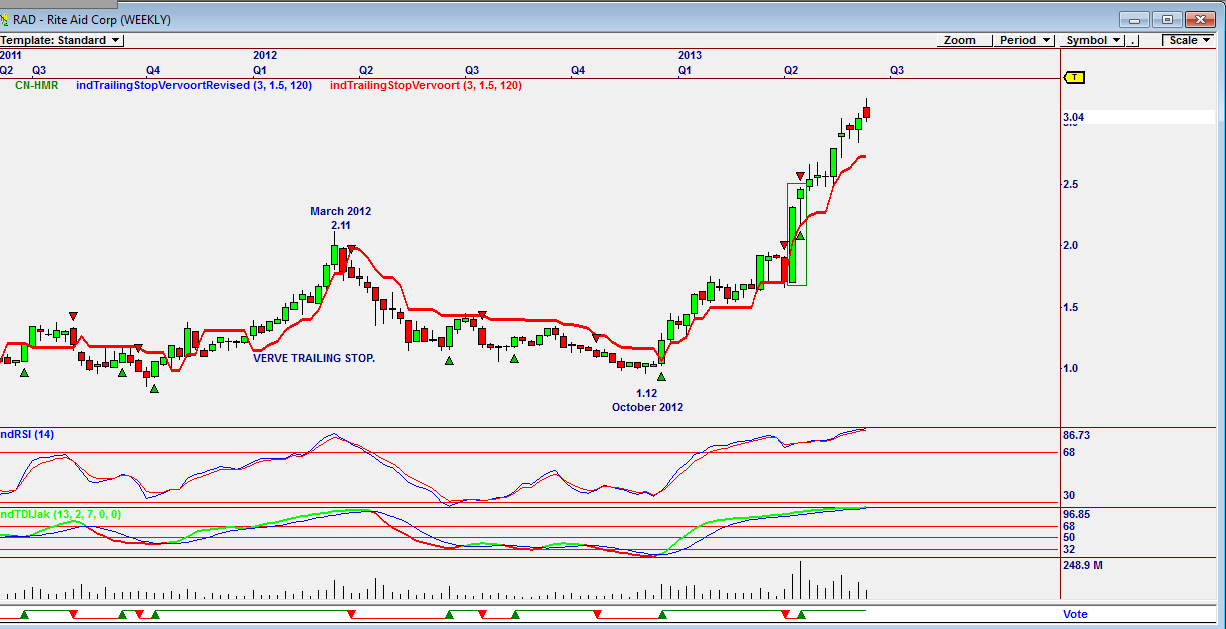
| Figure 2. Weekly chart showing strength after the US Presidential election. |
| Graphic provided by: Omnitrader. |
| |
| The weekly chart in Figure 2 shows how price fell from $2.11 in March 2012 to a low of $1.12 by October 2012. Skeptics could argue that this was because President Obama was expected to lose the Presidency, and his health care plan would be scrapped. Once it became apparent that President Obama would win a second term, the share price took off strongly, today trading at $3.04. The vote line, based on the JM Internal Band strategy is positive. |

|
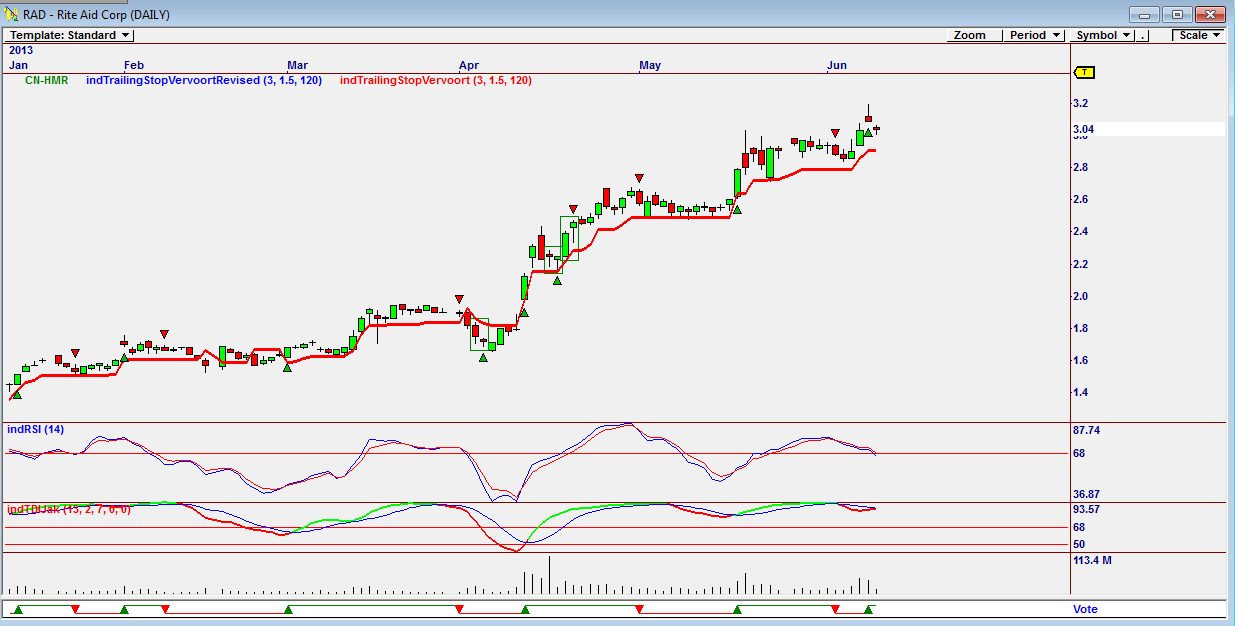
| Figure 3. Daily Chart showing a buy signal. |
| Graphic provided by: Omnitrader. |
| |
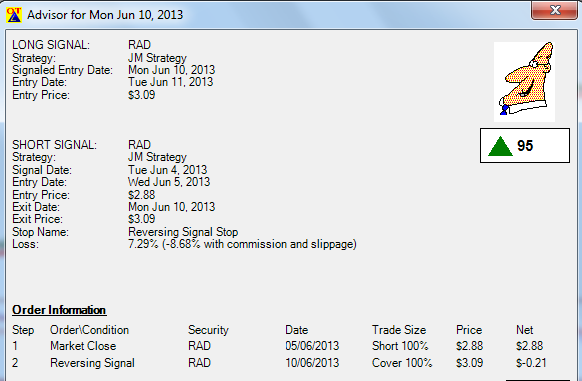
| The daily chart in Figure 3 shows a new JM internal band buy signal given on the vote line. The Advisor Rating shown in Figure 4 gave it 95 points based on a reversing signal stop. Note that volume did fall over the last two days as the price corrected, a sign of strength. The RSI indicator is trending down, but the TDI indicator has given a buy signal. Note the accuracy of the previous buy/sell signals on the vote line. |

|
| Figure 4. Advisor Rating. |
| Graphic provided by: Omnitrader. |
| |
| I would be a buyer of RAD at the present level. Whether or not the Affordable Care Act is influencing the share price is an assumption, but that more US citizens will be receiving medical care and prescription drugs is something you should keep in mind. |
Has been a technical analyst since 1969, and has worked as a futures and options trader with First Financial Futures in Johannesburg, South Africa.
| Address: | 3256 West 24th Ave |
| Vancouver, BC | |
| Phone # for sales: | 6042634214 |
| E-mail address: | petroosp@gmail.com |
Click here for more information about our publications!
PRINT THIS ARTICLE

Request Information From Our Sponsors
- VectorVest, Inc.
- Executive Premier Workshop
- One-Day Options Course
- OptionsPro
- Retirement Income Workshop
- Sure-Fire Trading Systems (VectorVest, Inc.)
- Trading as a Business Workshop
- VectorVest 7 EOD
- VectorVest 7 RealTime/IntraDay
- VectorVest AutoTester
- VectorVest Educational Services
- VectorVest OnLine
- VectorVest Options Analyzer
- VectorVest ProGraphics v6.0
- VectorVest ProTrader 7
- VectorVest RealTime Derby Tool
- VectorVest Simulator
- VectorVest Variator
- VectorVest Watchdog
- StockCharts.com, Inc.
- Candle Patterns
- Candlestick Charting Explained
- Intermarket Technical Analysis
- John Murphy on Chart Analysis
- John Murphy's Chart Pattern Recognition
- John Murphy's Market Message
- MurphyExplainsMarketAnalysis-Intermarket Analysis
- MurphyExplainsMarketAnalysis-Visual Analysis
- StockCharts.com
- Technical Analysis of the Financial Markets
- The Visual Investor
