

HOT TOPICS LIST
- MACD
- Fibonacci
- RSI
- Gann
- ADXR
- Stochastics
- Volume
- Triangles
- Futures
- Cycles
- Volatility
- ZIGZAG
- MESA
- Retracement
- Aroon
INDICATORS LIST
LIST OF TOPICS
PRINT THIS ARTICLE
by Donald W. Pendergast, Jr.
Shares of Maxim Integrated Products, Inc. have declined by nearly 15% in the last month but may now be nearing a critical support test.
Position: N/A
Donald W. Pendergast, Jr.
Freelance financial markets writer and online publisher of the Trendzetterz.com S&P 500 Weekly Forecast service.
PRINT THIS ARTICLE
SUPPORT & RESISTANCE
MXIM: Prepping For A Bounce?
06/12/13 02:38:16 PMby Donald W. Pendergast, Jr.
Shares of Maxim Integrated Products, Inc. have declined by nearly 15% in the last month but may now be nearing a critical support test.
Position: N/A
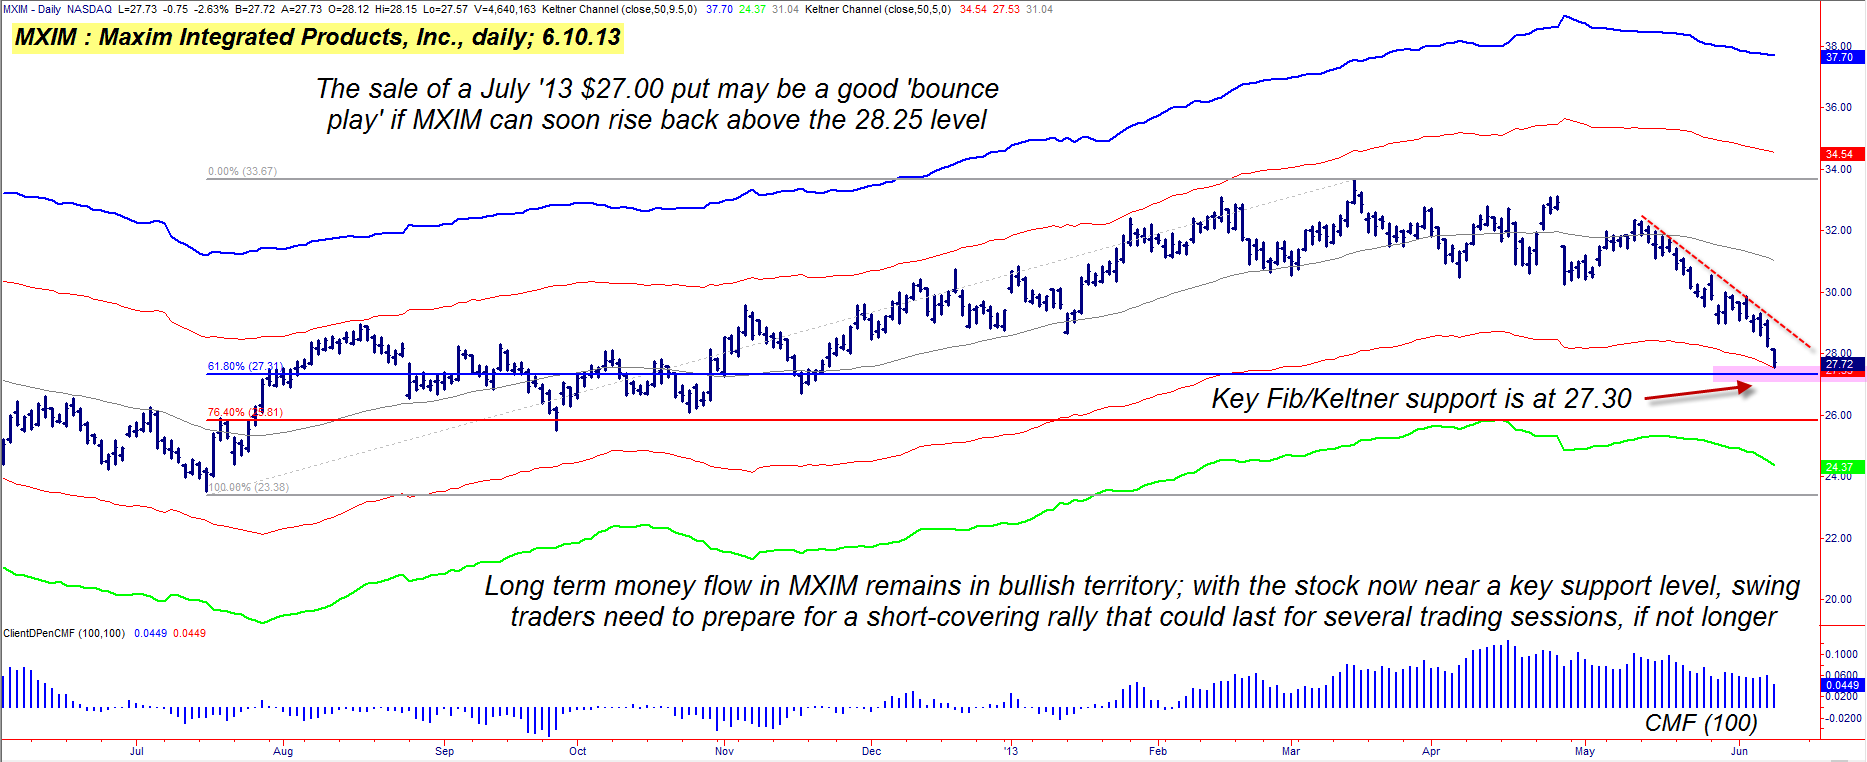
| Maxim Integrated Products, Inc. (MXIM) common stock has been manifesting a regular cyclical pattern over the past 10 to 12 months, and is no doubt a real favorite with swing traders – note the smooth ascents and descents into cycle highs and lows during bullish and bearish runs in the stock. The 10- and two-day price cycles have frequently combined to produce tradable swing highs and lows on at least 10 occasions since early last summer. Presently, MXIM is being driven lower by a much higher degree price cycle – falling by about 15% since May 10, 2013 – and the selling may be getting a bit overdone, with a short-term bounce getting more likely with every passing day. Here's a look at what might turn out to be a low-risk, short-term reversal play in this large cap tech issue (Figure 1). |
|
| Figure 1.: MXIM's latest sell-off may be at or near a key Fibonacci/Keltner support level, one that could trigger a tradable bounce higher. |
| Graphic provided by: TradeStation. |
| |
| Peaking at $32.34 in early May, MXIM has had a very low volatility decline from its Keltner mid-line to the next lower band at $27.53; this suggests that although the selling pressure has been steady it has been by no means anything like a panic run for the exits. In fact, if we look at the long term Chaikin Money flow histogram (CMF)(100) we find that the falling trend in the money flow is less severe than in the stock itself; the histogram also remains well above its zero line, yet another factor in favor of a near-term bullish reversal. Interestingly, the 62% Fibonacci retracement of the entire move higher from July 2012 to March 2013 is at 27.35, just beneath the Keltner band at 27.53. Unless there is some unexpected negative news surrounding the stock in the next week or so, it appears that MXIM is soon going to find near-term support and then bounce higher for at least a few trading sessions, if not more. |
|
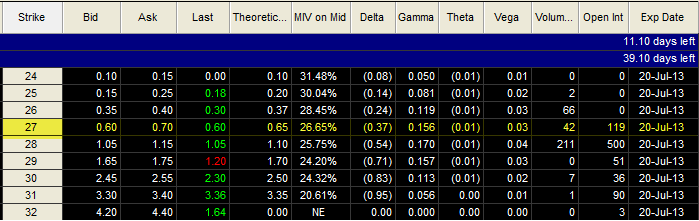
| Figure 2. If MXIM can soon rise back above 28.25 – after a successful bounce higher from support – selling the July '13 $27.00 put might be a logical short-term trade. |
| Graphic provided by: TradeStation. |
| Graphic provided by: TradeStation Options Analysis. |
| |
| Playing this potential reversal is fairly straightforward, especially for skilled sellers of naked put options: 1. If MXIM breaks above 28.25, consider selling the July '13 MXIM $26.00 put option, risking no more than 1% of your account value. This put has a modest bid/ask spread and features a strike price that is about thirty-five cents beneath the most recent daily low made in this stock. Open interest comes in at 119 contracts. 2. Since no one knows just how far MXIM will rise after a successful test of support, it's vital to have a game plan in place prior to making this trade; if the put declines in value by 50 to 60%, consider closing it out for a decent profit, getting back into cash as soon as you can. Conversely, if the stock drops back below 27.25 and/or the put doubles in price, just buy it back at a loss and wait for a better trade setup. By the way, stock traders can use the same entry point at 28.25; consider the use of a two- to three-bar trailing stop of the daily lows to help lock in gains and minimize losses; if the stock makes a sudden leap higher, use your own common sense and take at least half of your open gains off the table, letting the rest run until stopped out. Trade wisely until we meet here again. |
Freelance financial markets writer and online publisher of the Trendzetterz.com S&P 500 Weekly Forecast service.
| Title: | Market consultant and writer |
| Company: | Trendzetterz |
| Address: | 81 Hickory Hollow Drive |
| Crossville, TN 38555 | |
| Phone # for sales: | 904-303-4814 |
| Website: | trendzetterz.com |
| E-mail address: | support@trendzetterz.com |
Traders' Resource Links | |
| Trendzetterz has not added any product or service information to TRADERS' RESOURCE. | |
Click here for more information about our publications!
PRINT THIS ARTICLE

Request Information From Our Sponsors
- VectorVest, Inc.
- Executive Premier Workshop
- One-Day Options Course
- OptionsPro
- Retirement Income Workshop
- Sure-Fire Trading Systems (VectorVest, Inc.)
- Trading as a Business Workshop
- VectorVest 7 EOD
- VectorVest 7 RealTime/IntraDay
- VectorVest AutoTester
- VectorVest Educational Services
- VectorVest OnLine
- VectorVest Options Analyzer
- VectorVest ProGraphics v6.0
- VectorVest ProTrader 7
- VectorVest RealTime Derby Tool
- VectorVest Simulator
- VectorVest Variator
- VectorVest Watchdog
- StockCharts.com, Inc.
- Candle Patterns
- Candlestick Charting Explained
- Intermarket Technical Analysis
- John Murphy on Chart Analysis
- John Murphy's Chart Pattern Recognition
- John Murphy's Market Message
- MurphyExplainsMarketAnalysis-Intermarket Analysis
- MurphyExplainsMarketAnalysis-Visual Analysis
- StockCharts.com
- Technical Analysis of the Financial Markets
- The Visual Investor