

HOT TOPICS LIST
- MACD
- Fibonacci
- RSI
- Gann
- ADXR
- Stochastics
- Volume
- Triangles
- Futures
- Cycles
- Volatility
- ZIGZAG
- MESA
- Retracement
- Aroon
INDICATORS LIST
LIST OF TOPICS
PRINT THIS ARTICLE
by Donald W. Pendergast, Jr.
Shares of Qualcomm, Inc. look ripe for another spike lower to a key support level.
Position: N/A
Donald W. Pendergast, Jr.
Freelance financial markets writer and online publisher of the Trendzetterz.com S&P 500 Weekly Forecast service.
PRINT THIS ARTICLE
SUPPORT & RESISTANCE
Qualcomm: Breakdown Likely This Week?
06/11/13 03:33:46 PMby Donald W. Pendergast, Jr.
Shares of Qualcomm, Inc. look ripe for another spike lower to a key support level.
Position: N/A
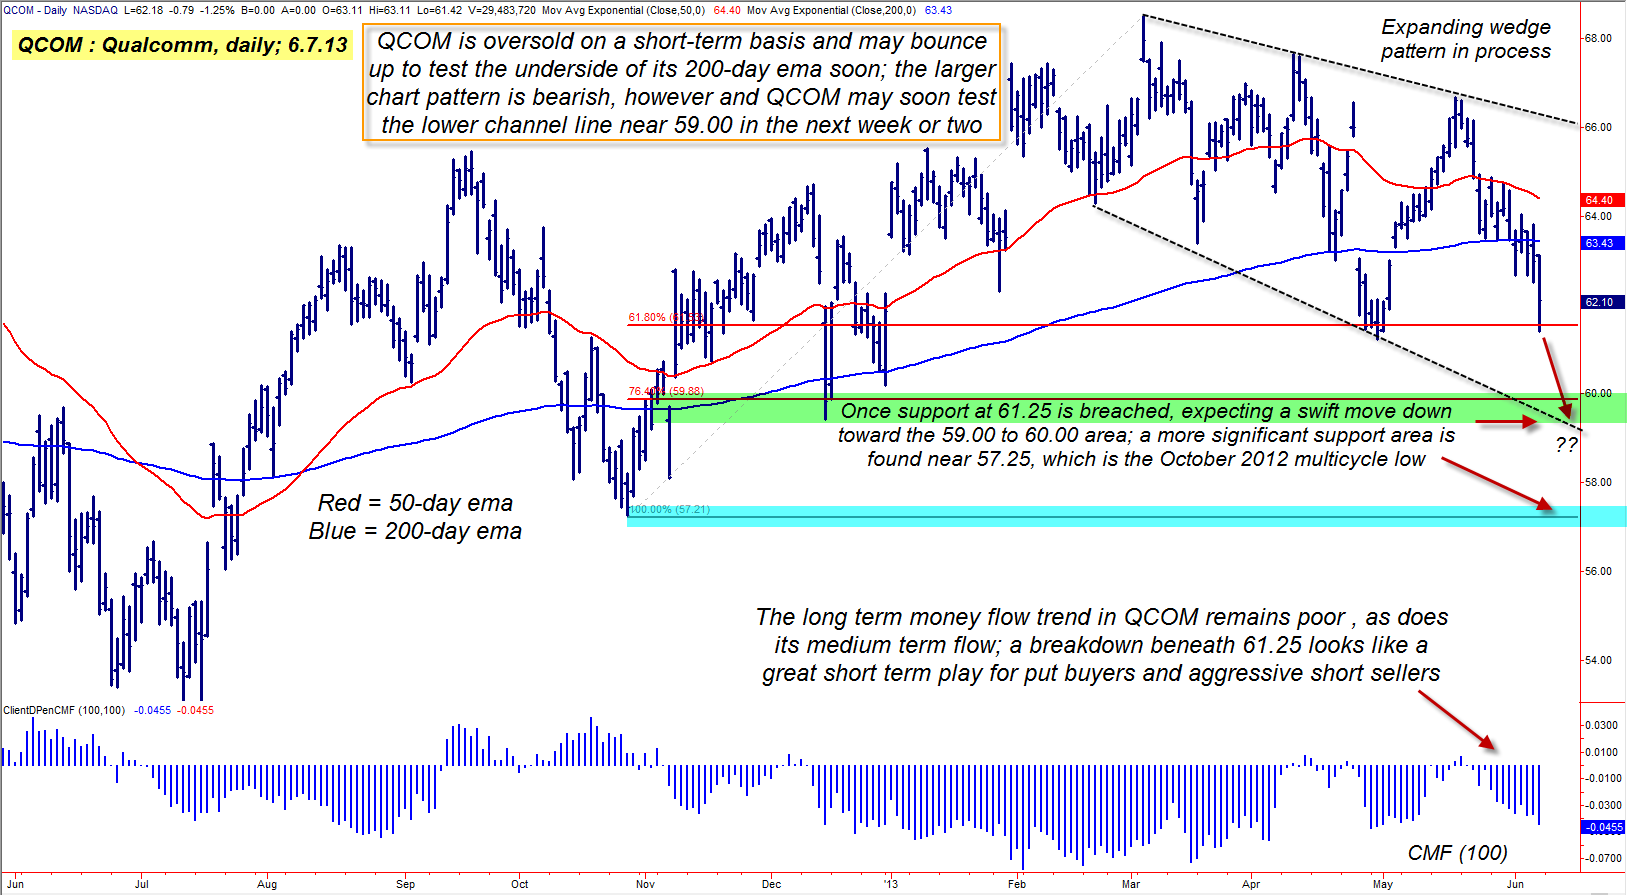
| Qualcomm, Inc. (QCOM) shares have been extremely volatile over the past eight months; there have been numerous – and quite large – daily gaps since October 2012 and although the stock had managed to stay above its key 200-day exponential moving average (EMA) for most of that time, as of late the stock has become enmeshed in a well defined expanding wedge pattern, one that seems hell-bent on driving the stock down beneath the 60.00 level, and in very short order. Here's a closer look. |
|
| Figure 1: Qualcomm's (QCOM) current downtrend should gather strength if and when the key support level at 61.25 is breached, with a fast move down toward 59.00 possible. |
| Graphic provided by: TradeStation. |
| |
| This daily chart of QCOM in Figure 1 is enough to give a die-hard trend follower fits; this is a stock that can't seem to trend for very long before making an abrupt u-turn or unexpected and frequently violent shakeout maneuver. But to a savvy chartist with an eye for critical chart patterns, this daily graph of QCOM is a real dandy, and here's why: 1. Since topping out at 66.65 on March 4, 2013, QCOM has traced out a beautiful pattern of lower swing highs and lower swing lows – a confirmed downtrend, in other words. 2. This downtrend has also formed a sizable descending wedge pattern, one that may soon witness the stock make a sharp move lower to test its lower channel line within the next week or two. 3. At the same time as these patterns have formed, QCOM's long term and short term money flow trends have gone into negative territory. 4. The stock is due for a minor bounce higher (perhaps to test its blue 200-day EMA near 63.43), but should it manage to break key support at 61.25, the heavy bearish pressure of all the above should make for a swift and smooth ride southward toward the 59.00 to 60.00 support areas (green shaded zone). |
|
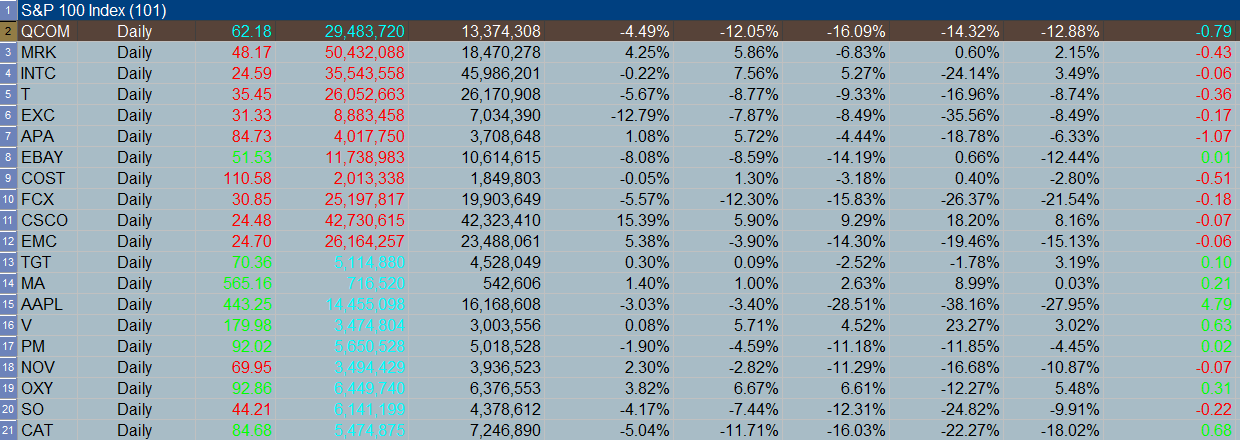
| Figure 2: QCOM has also been underperforming the S&P 500 index (.SPX) over the last 4-, 13-, 26- and 52-week periods; long and short term money flows remain bearish for the stock. |
| Graphic provided by: TradeStation. |
| Graphic provided by: TradeStation Radar Screen. |
| |
| Overall, the bias for QCOM over the next two to four weeks appears to be decidedly bearish; the stock is also underperforming the S&P 500 index (.SPX) over the past 4-, 13-, 26- and 52-week periods, which is yet another incentive for big institutional traders and investors to lighten up on their holdings of QCOM. Playing QCOM here is very simple: A. On an intraday break beneath 61.25, consider buying the August '13 QCOM 62.50 put option; this put has an excellent bid/ask spread of only a nickel (.05) and has a strong open interest figure of 3,246 contracts. This put is also in-the-money (ITM) and offers a bit more wiggle room for short term traders than its August 60.00 cousin. B. If filled on the trade, use 63.20 as your initial stop loss on the stock and plan on holding the trade until either you're stopped out by a two-bar trailing stop of the daily highs or until your initial profit target of 59.88 is reached; take at least half your open profits there (if not all); more aggressive traders might want to shoot for the greater gains that a continued decline might offer, but for most traders a touch of the lower channel line is as good an exit point as any. Risk no more than 2% of your account equity on this trade setup (assuming it triggers as anticipated) and remember to trade wisely until we meet here again. |
Freelance financial markets writer and online publisher of the Trendzetterz.com S&P 500 Weekly Forecast service.
| Title: | Market consultant and writer |
| Company: | Trendzetterz |
| Address: | 81 Hickory Hollow Drive |
| Crossville, TN 38555 | |
| Phone # for sales: | 904-303-4814 |
| Website: | trendzetterz.com |
| E-mail address: | support@trendzetterz.com |
Traders' Resource Links | |
| Trendzetterz has not added any product or service information to TRADERS' RESOURCE. | |
Click here for more information about our publications!
PRINT THIS ARTICLE

Request Information From Our Sponsors
- StockCharts.com, Inc.
- Candle Patterns
- Candlestick Charting Explained
- Intermarket Technical Analysis
- John Murphy on Chart Analysis
- John Murphy's Chart Pattern Recognition
- John Murphy's Market Message
- MurphyExplainsMarketAnalysis-Intermarket Analysis
- MurphyExplainsMarketAnalysis-Visual Analysis
- StockCharts.com
- Technical Analysis of the Financial Markets
- The Visual Investor
- VectorVest, Inc.
- Executive Premier Workshop
- One-Day Options Course
- OptionsPro
- Retirement Income Workshop
- Sure-Fire Trading Systems (VectorVest, Inc.)
- Trading as a Business Workshop
- VectorVest 7 EOD
- VectorVest 7 RealTime/IntraDay
- VectorVest AutoTester
- VectorVest Educational Services
- VectorVest OnLine
- VectorVest Options Analyzer
- VectorVest ProGraphics v6.0
- VectorVest ProTrader 7
- VectorVest RealTime Derby Tool
- VectorVest Simulator
- VectorVest Variator
- VectorVest Watchdog